


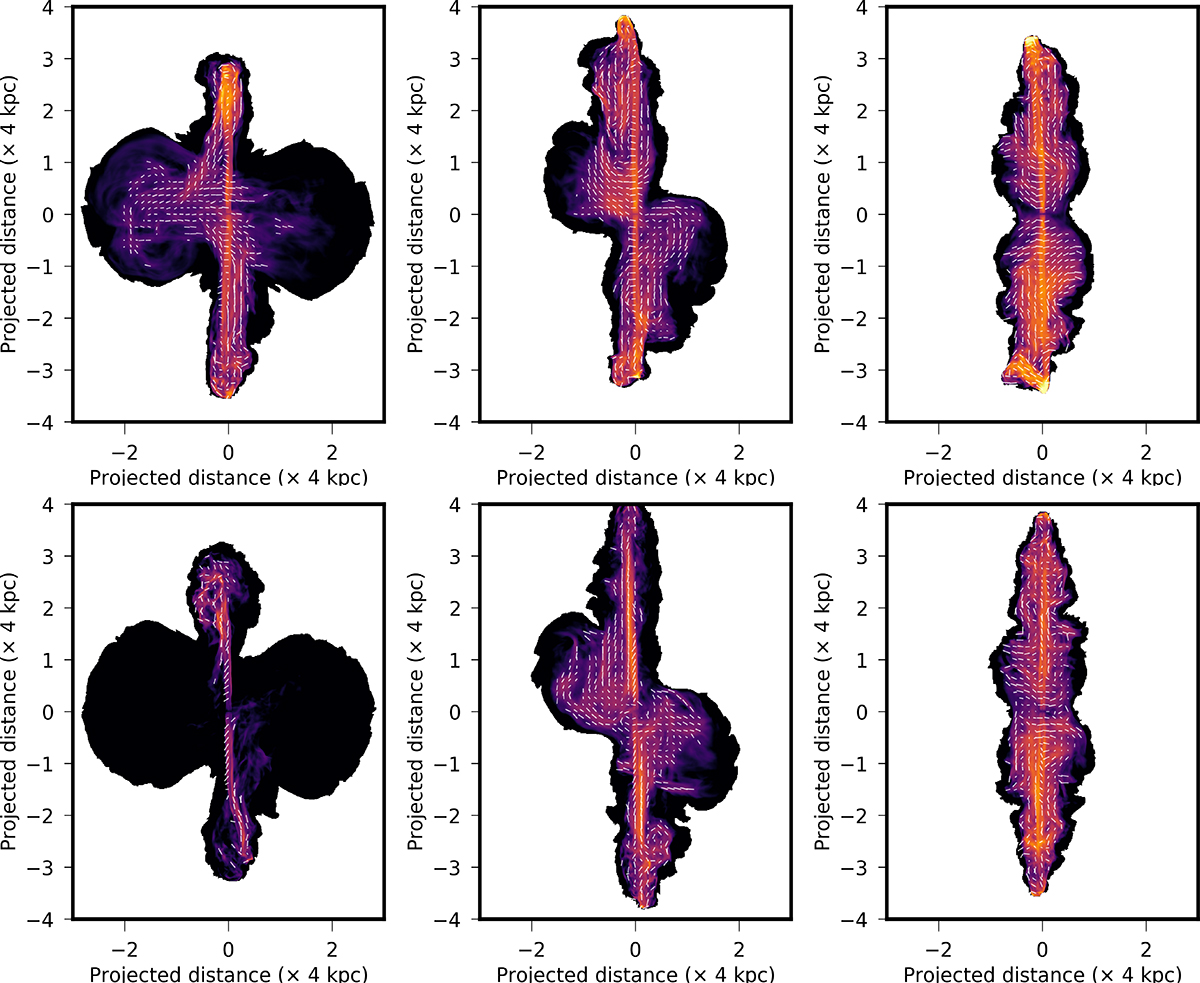
Fig. B.2.
Download original image
Projected magnetic field orientations, derived from polarized emission (line lengths are proportional to fractional polarization values), are overlaid on the intensity color map (using the same color-scale range as Fig. 8). The resulting distribution closely mirrors the broad-scale magnetic field structure seen in the 3D volume-rendered maps (Fig. B.1). The evolution from an initially toroidal field configuration (at injection) to a helicoidal and subsequently poloidal structure is particularly evident along the jet spine. This field is further compressed at the hotspot regions, a feature that is especially pronounced in the high-magnetization cases (top panel). Within the cocoon and secondary structures, the magnetic field appears to broadly align with the underlying flow patterns (e.g., Black et al. 1992; Baghel et al. 2023).
Current usage metrics show cumulative count of Article Views (full-text article views including HTML views, PDF and ePub downloads, according to the available data) and Abstracts Views on Vision4Press platform.
Data correspond to usage on the plateform after 2015. The current usage metrics is available 48-96 hours after online publication and is updated daily on week days.
Initial download of the metrics may take a while.