| Issue |
A&A
Volume 660, April 2022
|
|
|---|---|---|
| Article Number | L10 | |
| Number of page(s) | 5 | |
| Section | Letters to the Editor | |
| DOI | https://doi.org/10.1051/0004-6361/202243463 | |
| Published online | 21 April 2022 | |
Letter to the Editor
Discovery of X-shaped morphology of the giant radio galaxy 0503-286
1
Observatoire de Paris, LERMA, Collège de France, CNRS, PSL University, Sorbonne University, 75014 Paris, France
e-mail: This email address is being protected from spambots. You need JavaScript enabled to view it.
2
UM-DAE Centre of Excellence in Basic Sciences (CEBS), Vidyanagari, Mumbai 400098, India
Received:
3
March
2022
Accepted:
1
April
2022
Abstract
The high surface-brightness sensitivity of the galactic and extragalactic all-sky mwa survey (GLEAM) image of the giant radio galaxy (GRG) 0503-28 at 70–230 MHz has revealed an inversion-symmetric bending of its two lobes, while maintaining a ∼200 kpc wide strip-like radio emission gap between their bent portions. This lends the source the appearance of a mega-sized X-shaped radio galaxy. Identifying the emission gap with the presence of a gaseous layer, probably a WHIM-filled sheet in the cosmic web, we suggest that the layer is the most likely cause of the inversion-symmetric bending of the two radio lobes. Multiple observational manifestations of such gaseous layers are noted. The two lobes of this GRG, known to extend very asymmetrically from the host galaxy, are remarkably symmetric about the emission gap, confirming a curious trend noted earlier for double radio sources of normal dimensions. The anomalous radio spectral gradient reported for the northern lobe of this GRG is not substantiated.
Key words: galaxies: jets / galaxies: active / intergalactic medium / galaxies: groups: general / radio continuum: galaxies
© P. Dabhade and G. Krishna 2022
 Open Access article, published by EDP Sciences, under the terms of the Creative Commons Attribution License (https://creativecommons.org/licenses/by/4.0), which permits unrestricted use, distribution, and reproduction in any medium, provided the original work is properly cited.
1. Introduction
Starting from their discovery (Willis et al. 1974), giant radio galaxies (GRGs) have been used as effective probes of the intergalactic medium (IGM). Since their radio lobes typically extend well beyond the virial radius of the host galaxy, they directly interact with the warm-hot gaseous phase of the IGM, called the warm-hot intergalactic medium (WHIM), which is thought to contain roughly half the baryons in the Universe, mostly confined to sheets and filaments delineating the large-scale structure of the Universe (e.g., Fukugita et al. 1998; Cen & Ostriker 1999; Davé et al. 2001; Shull et al. 2012). Until the mid-1980s, only about a dozen GRGs (size > 1 Mpc1) were known. Of these, GRG 0503-286 (MSH05-22), hosted by the luminous elliptical galaxy ESO 422-G028 at z = 0.03815 and having the radio lobe pair spanning 1.8 Mpc (∼40′), was the largest known galaxy in the southern sky. Its discovery2 was reported independently by two groups (Saripalli et al. 1986, hereafter, SGRK86 and Subrahmanya & Hunstead 1986, SH86). The former paper reported its imaging observations at 327 MHz with the Ooty Synthesis Radio Telescope (OSRT, Swarup 1984), which was the precursor to the Giant Metrewave Radio Telescope (GMRT, Swarup 2021), and also at 1.4 GHz and 2.7 GHz using the 100-m Effelsberg Radio Telescope. The moderate luminosity of this GRG (P1.4 ∼ 1.07 × 1025 W Hz−1) places it on the dividing line between FR I and FR II radio sources (Fanaroff & Riley 1974). This is consistent with its lobes lacking a prominent brightness peak and also with its large spectral age of ∼0.3 Gyr (Subrahmanyan et al. 2008, hereafter SSSH08). Radio polarisation imaging of this GRG has been carried out over the frequency range from about 100 MHz to 5 GHz (SGRK86; Condon et al. 1998; Jamrozy et al. 2005; Riseley et al. 2018). The elliptical host galaxy, with a young stellar population (< 10 Myr) in the north-west region, has been classified as a low-excitation radio galaxy (LERG; Zovaro et al. 2022) and low-ionisation nuclear emission-line region (LINER; Véron-Cetty & Véron 2010), consistent with the non-detection of [OIII] and Hβ emission lines reported in the discovery papers (SH86; SGRK86). Arguably, this source remains the most assiduously observed GRG, prompted by its highly unusual radio morphology which is marked by the strikingly dissimilar extents and appearances of its two radio lobes, compounded by a large offset and misalignment of the N-lobe from the well-defined radio axis of this GRG. SH86 proposed that this GRG may simply be a large ‘bent-double’ radio source seen in projection. However, in SGRK86, a denser gaseous medium inferred from the higher (projected) concentration of galaxies to the north-east or east of the N-lobe was deemed responsible for both (i) the smaller length of the N-lobe and (ii) for driving this diffuse lobe westward via an action of a buoyancy force exerted by the thermal gas associated with the galaxy concentration. As discussed in Sect. 2, this scenario finds support from subsequent optical studies of the large-scale environment of this GRG and also by the distribution of ROSAT detected discrete X-rays sources towards it (Jamrozy et al. 2005, hereafter J05).
The above-mentioned early work on galaxy clustering around the GRG 0503-28 was revisited in a seminal study by SSSH08, by measuring spectroscopic redshifts of over 350 galaxies seen within ∼1° of GRG 0503-28. Its massive elliptical host galaxy was shown to be associated with a small unvirialised group of four to five galaxies within ∼0.3 Mpc (see, also, Tully 2015), from which no extended X-ray emission is detected in the 22 ks ROSAT pointed observations (J05). SSSH08 detected a ∼100 Mpc long sheet-like filamentary galaxy distribution approaching to within 10–15 Mpc north-east of the host galaxy (see also, Kalinkov & Kuneva 1995; Jones et al. 2004). The VLA maps of this GRG at 1.5 GHz and 4.9 GHz have confirmed the very different morphologies of the two lobes and also revealed a ∼90 kpc long straight jet pointing towards the S-lobe (Fig. 6 of SSSH08), as well as a fainter and shorter counter-jet, both co-linear with the elongated S-lobe. Thus, the overall radio axis of this GRG is neatly defined (SSSH08). It was further argued by these authors that the large displacement of the N-lobe from the radio source axis towards the south-west as well as its misaligned orientation from that axis are plausibly due to the buoyancy force exerted by a denser ambient IGM under the gravitational pull of the afore-mentioned sheet-like galaxy distribution located ∼10–15 Mpc north-east of the N-lobe, with additional push coming from a galactic superwind emanating from a dense galaxy clustering ∼2 Mpc north-east of the host galaxy. In this context it is interesting that as many as six ROSAT detected discrete X-ray sources without an optical counterpart are arrayed along the eastern rim of the N-lobe, which is in stark contrast to the S-lobe (J05). Adding to the above work, Malarecki et al. (2015) have reported optical spectroscopy of 9076 galaxies seen in the environments of 19 GRGs, and they show that the shorter lobe lies on the side of larger galaxy number density, reaffirming the previous studies based on fewer GRGs (SSSH08; Safouris et al. 2009; SGRK86). They also found supportive evidence for (i) the GRG lobes to get misaligned from the overall radio axis due to their components being deflected away by galaxy over-densities in the ambient space, and (ii) a tendency for the radio lobes that are ejected along directions avoiding denser galaxy distributions to be able to grow to giant sizes. However, a generalisation that higher ambient IGM density inhibits GRG formation has been weakened by the recent detailed study of the megaparsec-scale environments of ∼150 GRGs (Tang et al. 2020; Lan & Xavier Prochaska 2021) and, perhaps more directly, by the finding that at least 10% of the GRGs reside in centres of galaxy clusters (Dabhade et al. 2020a,b). This would then appeal to the alternative explanation in which the GRG phenomenon is attributed to a more powerful central engine (Gopal-Krishna et al. 1989; Subrahmanyan et al. 1996), which may conceivably be related to the central engines of GRGs operating at lower Eddington ratios, compared to regular size radio galaxies (Dabhade et al. 2020a).
In Sect. 2 we present and discuss new features of the lobes of GRG 0503-286, gleaned from the its low-frequency radio maps of exceptionally high surface-brightness sensitivity, made in The galactic and extragalactic all-sky mwa (GLEAM) survey3 (Hurley-Walker et al. 2017) using the Murchison Widefield Array (Tingay et al. 2013). These maps have revealed an X-shaped morphology in this GRG, shedding new light on the underlying mechanism. The main conclusions from this study are summarised in Sect. 3.
2. Results and discussion
2.1. Discovery of inversion-symmetric bending of the lobes
Figure 1 shows the GLEAM survey maps of GRG 0503-286 in four consecutive frequency bands within 70–230 MHz. These sensitive maps clearly show that the two lobes, while approaching each other, gradually undergo a substantial bending in opposite directions, whereafter they run parallel to each other, maintaining a strip-like radio emission gap between them. The sharp quasi-linear inner edges of the bent lobes (‘spurs’) are more clearly visible in the three higher frequency GLEAM maps due to their superior resolution. This morphology is reminiscent of X-shaped radio galaxies (XRGs; see Gopal-Krishna et al. 2012, for a review), with the two radio spurs being analogues of the radio ‘wings’ (‘secondary’ lobes) observed in XRGs. In a currently popular model (Leahy & Williams 1984), the wings form as the hydrodynamic backflow of synchrotron plasma in the twin radio lobes is deflected sideways (see below). Although this model is challenged by XRGs in which the wings are distinctly longer than the primary lobes (see, e.g., Leahy & Perley 1991), a possible explanation for this can be found in Capetti et al. (2002), Kraft et al. (2005), and Hodges-Kluck & Reynolds (2011).
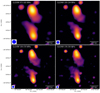 |
Fig. 1. GLEAM radio maps in four bands, where the beam is shown via a blue circle. The resolutions (FWHM) of the images from 70 to 230 MHz are 4.84′ × 4.57′, 77.4°; 3.43′ × 3.35′, 76.2°; 2.63′ × 2.58′, 62.1°; and 2.19′ × 2.16′, 37.3°. The location of the host galaxy is marked with a green circle. The radio emission seen in colour is above 3σ, where σ is the rms of each map given in Table 1. |
By far, the most spectacular example of an X-shaped GRG is seen in the recent MeerKAT map of PKS 2014-55 (size ∼ 1.57 Mpc), where the hydrodynamic backflow in each lobe appears to undergo a sharp deflection (almost a reflection), imparting the source with the appearance of a ‘double boomerang’ (Cotton et al. 2020). Although, there is no trace of hot or warm spots in the lobes, this FR I morphology of both its ‘primary’ lobes may still be reconciled with the backflow model by postulating that the primary lobes had an FR II past (Saripalli & Subrahmanyan 2009). Whilst the possibility of a morphological transition from FR II to FR I, due to an interplay between the jet power as well as the density and temperature of the external medium, has been deemed feasible for a long time (Gopal-Krishna & Wiita 1988, 2001; Gopal-Krishna 1991; Bicknell 1995), the sustenance of a well-collimated backflow after the demise of the Mach disk (hot spot) has yet to be demonstrated.
The hydrodynamic backflow model invoking a large halo of coronal gas around the host elliptical galaxy (Leahy & Williams 1984) gets stretched when applied to the present GRG 0503-28. Not only is the combined lateral span of its two lobes, which are sought to be deflected, huge (∼0.9 Mpc), necessitating a cluster-size halo of hot gas, but even the region which the two lobes approach before getting deflected in opposite directions is devoid of a conspicuous galaxy. The only massive galaxy seen between the two lobes is the parent galaxy of the GRG (as marked in Fig. 1) and it is situated far away (∼350 kpc) from the point of inversion symmetry of the deflected lobe pair. The galaxy is, in fact, located at the boundary of the strip-like radio emission gap (Sect. 2.3). Several such intriguing examples are discussed in Gopal-Krishna & Wiita (2009). We also note that post-bending, the sharp quasi-linear inner edges of the two lobes run almost parallel to each other for ∼700 kpc, end to end, separated by the emission gap (Fig. 1). All this suggests that the backflows in the two radio lobes are being docked by a fat pancake type gaseous layer, which is possibly a segment of a sheet of the cosmic web permeated by WHIM (Sect. 2.2). This possibility has been proposed in earlier studies, together with the stipulation that the putative gaseous layer should be a structure of a quasi-permanent nature which does not get disrupted due to any motion of the host galaxy away from the symmetry region (Gopal-Krishna & Wiita 2000, 2009). In the present case of GRG 0503-286, such a movement of the host galaxy seems implausible, anyway, given its location right on the radio axis so robustly defined by the alignment of the straight radio jet, counter-jet, and the elongated S-lobe (Figs. 4 and 6 of SSSH08). This suggests that the origin of the gaseous layer invoked to explain the radio emission gap is probably not linked to the host galaxy itself, rather the layer has existed independently of the galaxy and could well be a WHIM-permeated sheet of the cosmic web (Sect. 2.2).
2.2. Radio emission gap as the symmetry plane for twin-lobes
Well over a dozen FR II radio galaxies have been reported to exhibit strip-like regions of depressed radio emission (typical width ∼30 kpc, but with a wide range), separating the two radio lobes and usually running almost orthogonally to the axis defined by them (Gopal-Krishna & Wiita 2000, 2009; Gopal-Krishna et al. 2007). Since the quasi-linear sharp edges seen between the lobes in these double radio sources would only be observable when the radio axis is oriented near the plane of the sky (in order for the twin radio lobes to not appear to be partially overlapping), such emission gaps and the proposed gaseous ‘superdisks’, ‘fat pancakes’, or, ‘cosmic sheets’ causing them are probably associated with many more radio galaxies than found so far. As summarised in these papers, the well-known phenomena, for which the proposed fat pancakes may provide a viable alternative explanation, include the following: (i) the radio lobe depolarisation asymmetry, popularly known as the Laing-Garrington effect (Garrington et al. 1988; Laing 1988) (see, Gopal-Krishna & Nath 1997); (ii) the correlated radio-optical asymmetry of double radio sources (McCarthy et al. 1991) (see, Gopal-Krishna & Wiita 1996); (iii) the occurrence of absorption dips in the Ly-α emission profiles of high-z radio galaxies with a total radio extent of up to ∼50 kpc (van Ojik et al. 1997; Binette et al. 2006) (see Gopal-Krishna & Wiita 2000); and (iv) the apparent asymmetry of the extended Ly-α emission associated with the lobes of high-z radio galaxies (see Gopal-Krishna & Wiita 2000, 2004). It was also argued that the proposed fat pancakes may be instrumental in causing metre-wavelength flux variability via ‘superluminal refractive scintillations’ (Gopal-Krishna 1991) see, also (Campbell-Wilson & Hunstead 1994; Ferrara & Perna 2001).
Further, the observed strip-like radio emission gaps in radio galaxies are relevant to the question of ‘what docks the tails of radio source components in double radio sources?’, raised by Jenkins & Scheuer (1976) who concluded that the answer to this cannot be synchrotron losses in the lobes. In fact, all these characteristics are connected to the more general and long-standing issue of asymmetries in double radio sources (reviewed, e.g., in Gopal-Krishna & Wiita 2004). Here, it is interesting to recall the curious, statistically significant trend that the two lobes in FR II radio galaxies are found to extend more symmetrically with respect to the radio emission gap than they do about the host galaxy (Gopal-Krishna & Wiita 2000, 2009). While the cause of this behaviour remains obscure, it may be noted that the present GRG is in full conformity to this trend. Even though its lobe-length ratio is exceptionally large (1: 1.6, SSSH08) among GRGs (Dabhade et al. 2020a), when measured relative to the host galaxy, the lobe-length asymmetry virtually disappears when referenced to the mid-plane of the emission gap (Fig. 1).
2.3. Possible content of the radio emission gap
The issue of the content of the gaseous layer, inferred using the radio emission gap as the signpost, has been recently discussed by Anand & Roy (2019) who also present the negative results of their VLA search for HI signal from the conspicuous emission gaps seen in four nearby radio galaxies (z = 0.03–0.09). Early hints that such gaseous layers (fat pancakes) are dusty emerged from the observed stark asymmetry of the extended Ly-α emission associated with the twin-lobes of high-z radio galaxies (Gopal-Krishna & Wiita 2000), and also from their correlated radio-optical asymmetry (Gopal-Krishna & Wiita 1996) (Sect. 2.2). A potentially interesting additional hint about the content of the putative gaseous layer in GRG 0503-286 comes from the ROSAT X-ray image of this field (J05) which shows a concentration of about ten discrete soft X-ray sources in the region of the putative layer (emission gap) between the two lobes. The optical identifications of these soft X-ray sources can be regarded as tentative, given the substantial uncertainty of the ROSAT positions. Thus, while it remains to be demonstrated if any of these X-ray sources are actually embedded within the putative gaseous layer, the localised enhancement in their surface density in this region indicates that some of them may even turn out to be peaks within an extended faint X-ray emission associated with the layer. This preliminary indication calls for sensitive X-ray imaging of this field.
2.4. Spectral index gradient along the lobes of GRG 0503-286
Figure 2 shows the radio spectra of the entire source and its two lobes based on the flux densities listed in Table 1 and referenced in the caption. The integrated spectrum can be fitted with two straight lines, with a slope α = −0.72 ± 0.02 up to ∼2.7 GHz and −0.98 ± 0.06 thereafter, until ∼5 GHz. A similar pattern can be discerned for the two lobes. The compact radio core associated with the host galaxy and the twin jets are only clearly detected in the VLA observations (SSSH08), and together they contribute a negligibly small fraction of the total emission (∼0.35% at 5 GHz).
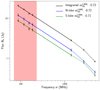 |
Fig. 2. Spectral index fit for flux densities of the GRG using the GLEAM (Table 1), Effelsberg (1.4 GHz and 2.7 GHz from SGRK86), and PMN survey at 5 GHz (SSSH08). The frequency range covered by GLEAM is shown by a red shaded area. |
Flux densities and rms of GRG 0503-286 from the four GLEAM maps.
SSSH08 presented spectral index distribution along the two lobes based on their maps at 843 MHz (MOST) and 1520 MHz (VLA, CnB array) at a common resolution of ∼1′. They found an unusual pattern for the N-lobe. While, its spectrum steepens towards the leading rim, it shows a flattening towards the host galaxy, in contrast to the pattern established for the lobes of edge-brightened double radio sources, and indeed also found by SSSH08 for the S-lobe of this GRG. This spectral contrast between the two lobes would add a further new dimension to the lobe asymmetry in this GRG. To examine this, we have compared the 4.8 GHz (FWHM = 2.4′; J05) and 2.7 GHz (FWHM = 4.3′; SGRK86) Effelsberg maps with the 170–230 MHz GLEAM map (FWHM = 2.19′ × 2.16′; Fig. 1) after smoothing the GLEAM map to the resolution of the respective Effelsberg maps, as shown in Fig. 3. The enormous frequency range (1: 24) covered by the maps lends a high degree of spectral precision; a 10% error in the ratio of flux densities at the two frequencies corresponds to a change of just 0.03 in the spectral index. Figure 3 shows the spectral index profiles along the axes of the northern and southern lobes marked with red and blue lines. A small but significant steepening towards the leading edge is observed for both lobes. However, we find no indication that in the N-lobe,  and
and  flatten towards the host galaxy; the opposite is seen in conformity with the spectral gradient reported in SGRK86. The origin of the discrepancy with the finding of SSSH08 remains to be understood. Indeed, the steepening trend of the spectral profiles of both lobes (Fig. 3), as inferred from the three most suitable radio maps available, is in agreement with the expectation of a steeper spectrum for the wings.
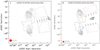 |
Fig. 3. 170–230 MHz GLEAM contour maps with 4.3′ (I; left side) and 2.4′ (II; right side) resolutions, showing spectral index ( |


3. Conclusions
The recent GLEAM survey maps of the GRG 0503-28, covering the 70–230 MHz band with a very high surface-brightness sensitivity, has enabled us to revisit some of the reported intriguing aspects of its exceptional lobe asymmetry. These new maps unveil an X-shaped radio morphology of this GRG, by revealing inversion-symmetric bending of its radio lobes, while maintaining a strip-like emission gap between their bent portions. If such a bending pattern were to arise from deflection of the backflow of the two lobes, in accord with a currently popular model, the only candidate massive galaxy that could have caused this is the host galaxy of the GRG. However, it is situated ∼350 kpc from the point of inversion symmetry of the bent radio lobes, near the northern edge of the emission gap and right on the robustly defined radio axis of this GRG. This strongly disfavours the possibility of the galaxy having migrated from the point of inversion symmetry to its present faraway location. We are led to postulate that both the inversion-symmetric lobe bending and the strip-like radio emission gap between the two bent lobes have a common cause, probably a gaseous layer which might be a WHIM-permeated sheet of the cosmic web. Various pieces of observational evidence and results in support of this proposal are summarised, including the one stemming from the existing ROSAT X-ray observations of the present GRG. Further, it is noted that GRG 0503-28, which is known for the exceptionally unequal extents of its two lobes, in fact extends symmetrically about the radio emission gap. This agrees with the previously reported trend for double radio sources of normal dimensions. Lastly, the reported anomalous radio spectral gradient in the northern lobe is not substantiated in this study.
We adopted a flat cosmology with parameters Ωm = 0.27, and a Hubble constant of H0 = 71 km s−1 Mpc−1.
The authors would like to dedicate this work to late Prof. Govind Swarup, FRS, who took special interest in the discovery of this giant radio galaxy in the southern hemisphere, with the Ooty Synthesis Radio Telescope (OSRT).
Acknowledgments
GK acknowledges a Senior Scientist fellowship of the Indian National Science Academy. We acknowledge that this work has made use of APLPY (Robitaille & Bressert 2012).
References
- Anand, A., Roy, N., & Gopal-Krishna., 2019, Res. Astron. Astrophys., 19, 083 [CrossRef] [Google Scholar]
- Bicknell, G. V. 1995, ApJS, 101, 29 [Google Scholar]
- Binette, L., Wilman, R. J., Villar-Martín, M., et al. 2006, A&A, 459, 31 [NASA ADS] [CrossRef] [EDP Sciences] [Google Scholar]
- Campbell-Wilson, D., & Hunstead, R. W. 1994, PASA, 11, 33 [NASA ADS] [CrossRef] [Google Scholar]
- Capetti, A., Zamfir, S., Rossi, P., et al. 2002, A&A, 394, 39 [NASA ADS] [CrossRef] [EDP Sciences] [Google Scholar]
- Cen, R., & Ostriker, J. P. 1999, ApJ, 514, 1 [NASA ADS] [CrossRef] [Google Scholar]
- Condon, J. J., Cotton, W. D., Greisen, E. W., et al. 1998, AJ, 115, 1693 [Google Scholar]
- Cotton, W. D., Thorat, K., Condon, J. J., et al. 2020, MNRAS, 495, 1271 [NASA ADS] [CrossRef] [Google Scholar]
- Dabhade, P., Mahato, M., Bagchi, J., et al. 2020a, A&A, 642, A153 [NASA ADS] [CrossRef] [EDP Sciences] [Google Scholar]
- Dabhade, P., Röttgering, H. J. A., Bagchi, J., et al. 2020b, A&A, 635, A5 [NASA ADS] [CrossRef] [EDP Sciences] [Google Scholar]
- Davé, R., Cen, R., Ostriker, J. P., et al. 2001, ApJ, 552, 473 [Google Scholar]
- Fanaroff, B. L., & Riley, J. M. 1974, MNRAS, 167, 31 [Google Scholar]
- Ferrara, A., & Perna, R. 2001, MNRAS, 325, 1643 [NASA ADS] [CrossRef] [Google Scholar]
- Fukugita, M., Hogan, C. J., & Peebles, P. J. E. 1998, ApJ, 503, 518 [NASA ADS] [CrossRef] [Google Scholar]
- Garrington, S. T., Leahy, J. P., Conway, R. G., & Laing, R. A. 1988, Nature, 331, 147 [Google Scholar]
- Gopal-Krishna 1991, A&A, 248, 415 [NASA ADS] [Google Scholar]
- Gopal-Krishna, & Nath, B. B. 1997, A&A, 326, 45 [NASA ADS] [Google Scholar]
- Gopal-Krishna, & Wiita, P. J. 1988, Nature, 333, 49 [Google Scholar]
- Gopal-Krishna, & Wiita, P. J. 1996, ApJ, 467, 191 [NASA ADS] [CrossRef] [Google Scholar]
- Gopal-Krishna, & Wiita, P. J. 2000, ApJ, 529, 189 [NASA ADS] [CrossRef] [Google Scholar]
- Gopal-Krishna, & Wiita, P. J. 2001, A&A, 373, 100 [NASA ADS] [CrossRef] [EDP Sciences] [Google Scholar]
- Gopal-Krishna, & Wiita, P. J. 2004, ArXiv e-prints [arXiv:astro-ph/0409761] [Google Scholar]
- Gopal-Krishna, & Wiita, P. J. 2009, New Astron., 14, 51 [NASA ADS] [CrossRef] [Google Scholar]
- Gopal-Krishna, Wiita, P. J., & Saripalli, L. 1989, MNRAS, 239, 173 [NASA ADS] [CrossRef] [Google Scholar]
- Gopal-Krishna, Wiita, P. J., & Joshi, S. 2007, MNRAS, 380, 703 [NASA ADS] [CrossRef] [Google Scholar]
- Gopal-Krishna, Biermann, P. L., Gergely, L. Á., & Wiita, P. J. 2012, Res. Astron. Astrophys., 12, 127 [NASA ADS] [CrossRef] [Google Scholar]
- Hodges-Kluck, E. J., & Reynolds, C. S. 2011, ApJ, 733, 58 [NASA ADS] [CrossRef] [Google Scholar]
- Hurley-Walker, N., Callingham, J. R., Hancock, P. J., et al. 2017, MNRAS, 464, 1146 [Google Scholar]
- Jamrozy, M., Kerp, J., Klein, U., Mack, K. H., & Saripalli, L. 2005, Balt. Astron., 14, 399 [NASA ADS] [Google Scholar]
- Jenkins, C. L., & Scheuer, P. A. G. 1976, MNRAS, 174, 327 [NASA ADS] [CrossRef] [Google Scholar]
- Jones, D. H., Saunders, W., Colless, M., et al. 2004, MNRAS, 355, 747 [NASA ADS] [CrossRef] [Google Scholar]
- Kalinkov, M., & Kuneva, I. 1995, A&AS, 113, 451 [NASA ADS] [Google Scholar]
- Kraft, R. P., Hardcastle, M. J., Worrall, D. M., & Murray, S. S. 2005, ApJ, 622, 149 [NASA ADS] [CrossRef] [Google Scholar]
- Laing, R. A. 1988, Nature, 331, 149 [Google Scholar]
- Lan, T.-W., & Xavier Prochaska, J. 2021, MNRAS, 502, 5104 [NASA ADS] [CrossRef] [Google Scholar]
- Leahy, J. P., & Perley, R. A. 1991, AJ, 102, 537 [Google Scholar]
- Leahy, J. P., & Williams, A. G. 1984, MNRAS, 210, 929 [CrossRef] [Google Scholar]
- Malarecki, J. M., Jones, D. H., Saripalli, L., Staveley-Smith, L., & Subrahmanyan, R. 2015, MNRAS, 449, 955 [NASA ADS] [CrossRef] [Google Scholar]
- McCarthy, P. J., van Breugel, W., & Kapahi, V. K. 1991, ApJ, 371, 478 [NASA ADS] [CrossRef] [Google Scholar]
- Riseley, C. J., Lenc, E., Van Eck, C. L., et al. 2018, PASA, 35, e043 [NASA ADS] [CrossRef] [Google Scholar]
- Robitaille, T., & Bressert, E. 2012, APLpy: Astronomical Plotting Library in Python [Google Scholar]
- Safouris, V., Subrahmanyan, R., Bicknell, G. V., & Saripalli, L. 2009, MNRAS, 393, 2 [NASA ADS] [CrossRef] [Google Scholar]
- Saripalli, L., & Subrahmanyan, R. 2009, ApJ, 695, 156 [NASA ADS] [CrossRef] [Google Scholar]
- Saripalli, L., Gopal-Krishna, Reich, W., & Kuehr, H. 1986, A&A, 170, 20 [NASA ADS] [Google Scholar]
- Shull, J. M., Smith, B. D., & Danforth, C. W. 2012, ApJ, 759, 23 [NASA ADS] [CrossRef] [Google Scholar]
- Subrahmanya, C. R., & Hunstead, R. W. 1986, A&A, 170, 27 [NASA ADS] [Google Scholar]
- Subrahmanyan, R., Saripalli, L., & Hunstead, R. W. 1996, MNRAS, 279, 257 [NASA ADS] [CrossRef] [Google Scholar]
- Subrahmanyan, R., Saripalli, L., Safouris, V., & Hunstead, R. W. 2008, ApJ, 677, 63 [NASA ADS] [CrossRef] [Google Scholar]
- Swarup, G. 1984, JApA, 5, 139 [NASA ADS] [Google Scholar]
- Swarup, G. 2021, ARA&A, 59 [Google Scholar]
- Tang, H., Scaife, A. M. M., Wong, O. I., et al. 2020, MNRAS, 499, 68 [Google Scholar]
- Tingay, S. J., Goeke, R., Bowman, J. D., et al. 2013, PASA, 30, e007 [Google Scholar]
- Tully, R. B. 2015, AJ, 149, 171 [NASA ADS] [CrossRef] [Google Scholar]
- van Ojik, R., Roettgering, H. J. A., Miley, G. K., & Hunstead, R. W. 1997, A&A, 317, 358 [NASA ADS] [Google Scholar]
- Véron-Cetty, M. P., & Véron, P. 2010, A&A, 518, A10 [Google Scholar]
- Willis, A. G., Strom, R. G., & Wilson, A. S. 1974, Nature, 250, 625 [Google Scholar]
- Zovaro, H. R. M., Riseley, C. J., Taylor, P., et al. 2022, MNRAS, 509, 4997 [Google Scholar]
All Tables
All Figures
|
Fig. 1. GLEAM radio maps in four bands, where the beam is shown via a blue circle. The resolutions (FWHM) of the images from 70 to 230 MHz are 4.84′ × 4.57′, 77.4°; 3.43′ × 3.35′, 76.2°; 2.63′ × 2.58′, 62.1°; and 2.19′ × 2.16′, 37.3°. The location of the host galaxy is marked with a green circle. The radio emission seen in colour is above 3σ, where σ is the rms of each map given in Table 1. |
| In the text | |
|
Fig. 2. Spectral index fit for flux densities of the GRG using the GLEAM (Table 1), Effelsberg (1.4 GHz and 2.7 GHz from SGRK86), and PMN survey at 5 GHz (SSSH08). The frequency range covered by GLEAM is shown by a red shaded area. |
| In the text | |
|
Fig. 3. 170–230 MHz GLEAM contour maps with 4.3′ (I; left side) and 2.4′ (II; right side) resolutions, showing spectral index ( |
| In the text | |
Current usage metrics show cumulative count of Article Views (full-text article views including HTML views, PDF and ePub downloads, according to the available data) and Abstracts Views on Vision4Press platform.
Data correspond to usage on the plateform after 2015. The current usage metrics is available 48-96 hours after online publication and is updated daily on week days.
Initial download of the metrics may take a while.