


Fig. 14.
Download original image
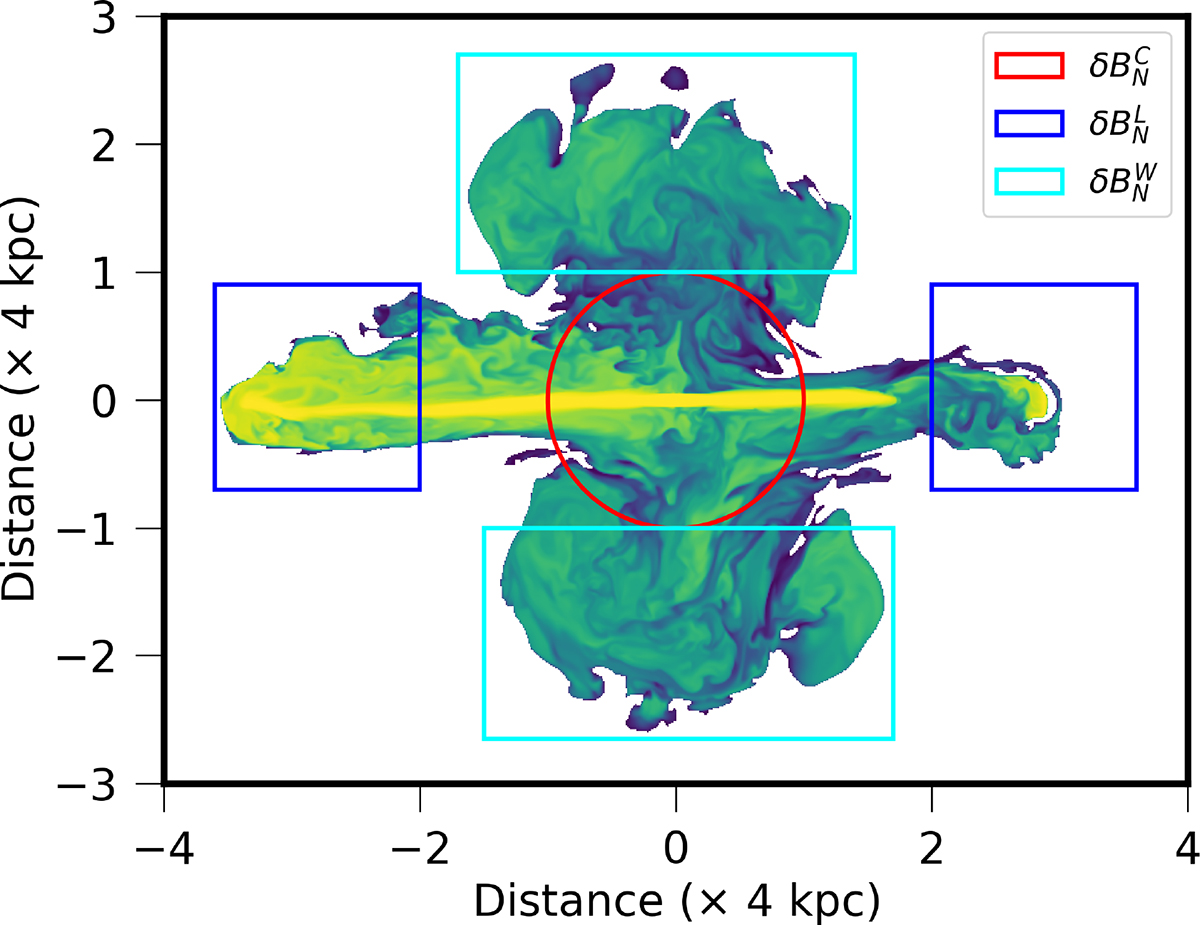
Two-dimensional color map of the jet tracer distribution (z = 0) for the X-shaped radio structure illustrating the segmentation of the source into three distinct regions: the active lobe (L), the wing (W), and the central region (C), where (back)flow redirection occurs. This regional dissection is performed to quantify the turbulence magnitude within each zone, providing insight into how jet-induced irregularities propagate and evolve throughout the overall flow zones.
Current usage metrics show cumulative count of Article Views (full-text article views including HTML views, PDF and ePub downloads, according to the available data) and Abstracts Views on Vision4Press platform.
Data correspond to usage on the plateform after 2015. The current usage metrics is available 48-96 hours after online publication and is updated daily on week days.
Initial download of the metrics may take a while.