


Fig. 11.
Download original image
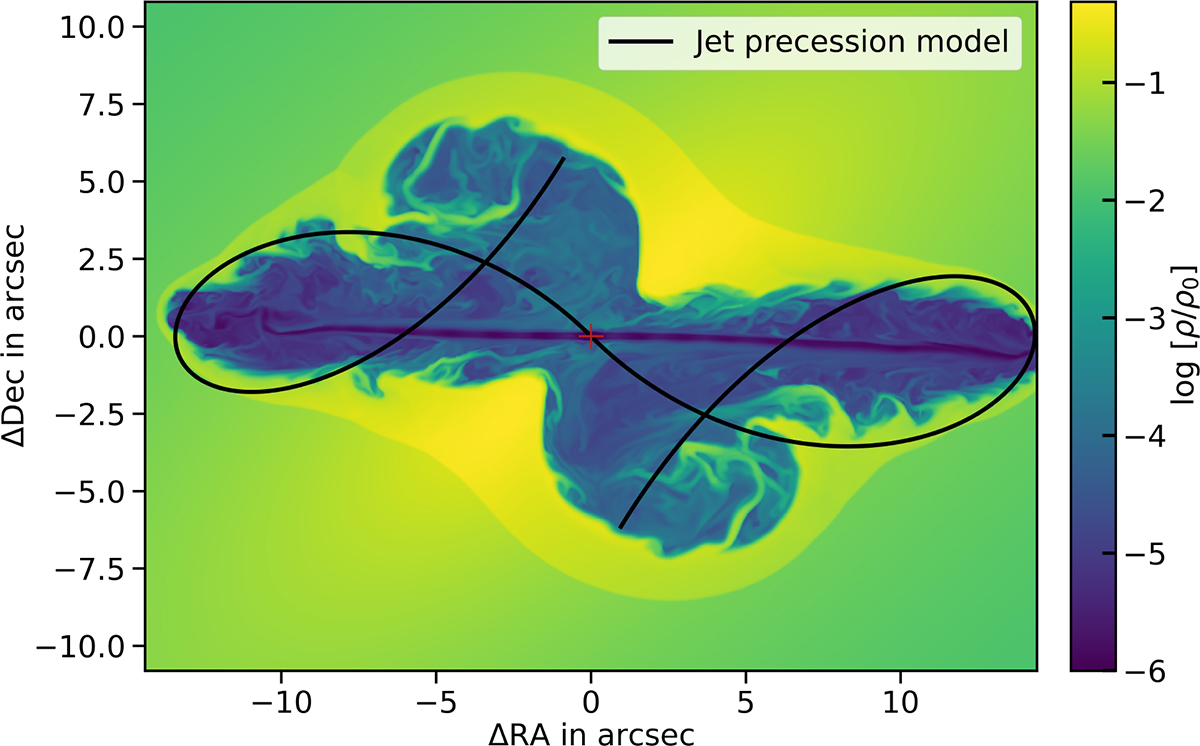
Composite image showcasing the simulated double-boomerang structure from the backflow model (density slice in color map) overlaid with an analytical jet trajectory (solid black line) generated utilising a jet precession model. Despite arising from distinct mechanisms, both structures represent resembling morphologies, highlighting the challenge in identifying the origin of XRGs based solely on their topological features. Each structure originates from the central coordinate (red marker) in the RA–Dec frame (assuming redshift 0.05). Notably, the two models share comparable lobe propagation speeds and evolutionary timescales.
Current usage metrics show cumulative count of Article Views (full-text article views including HTML views, PDF and ePub downloads, according to the available data) and Abstracts Views on Vision4Press platform.
Data correspond to usage on the plateform after 2015. The current usage metrics is available 48-96 hours after online publication and is updated daily on week days.
Initial download of the metrics may take a while.