Fig. 9
Download original image
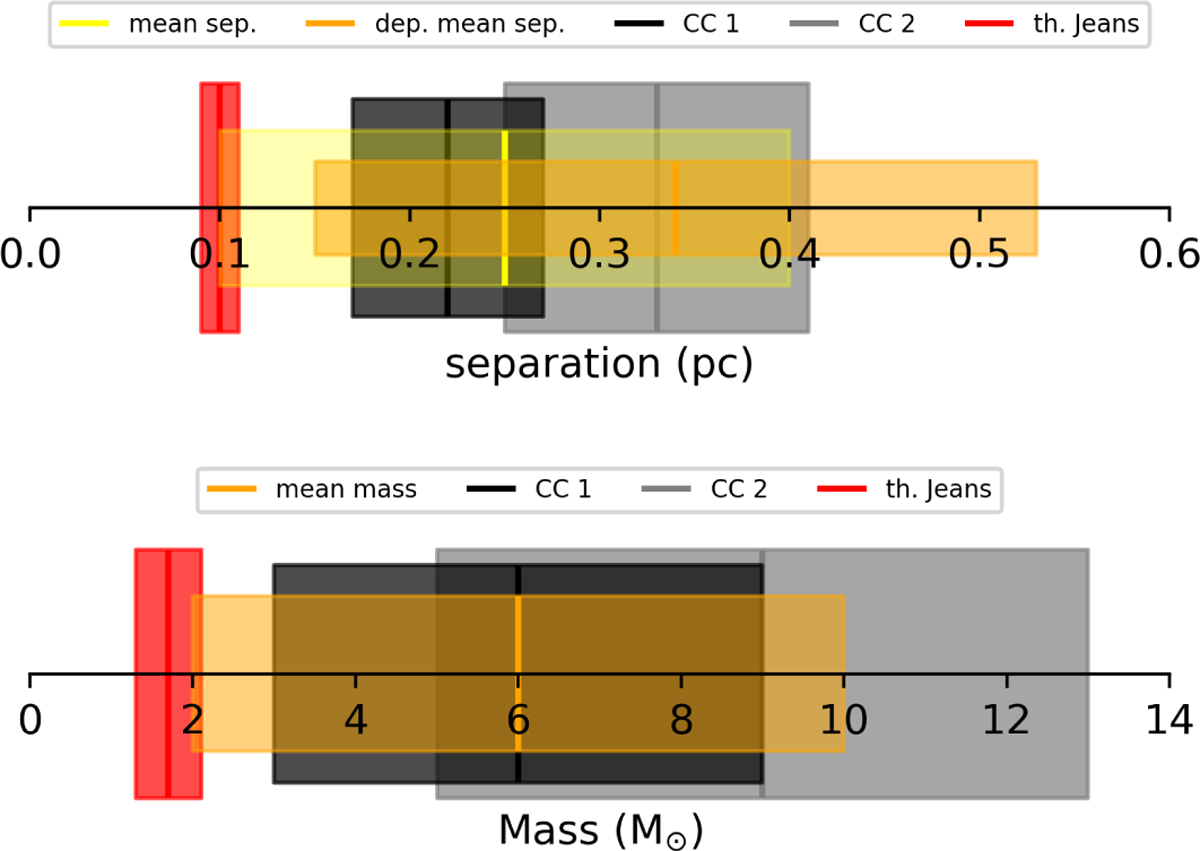
Upper panel: mean observed separation in yellow and mean deprojected separation in orange. The black, gray, and red boxes represent the values derived from the collect and collapse model with n0 = 5.1 × 104 cm−3 (CC 1), with n0 = 2 × 104 cm−3 (CC 2), and from the thermal Jeans fragmentation model, respectively. Lower panel: Mean mass of the fragments in orange. The black, gray, and red boxes represent the values derived from the same models in the upper panel.
Current usage metrics show cumulative count of Article Views (full-text article views including HTML views, PDF and ePub downloads, according to the available data) and Abstracts Views on Vision4Press platform.
Data correspond to usage on the plateform after 2015. The current usage metrics is available 48-96 hours after online publication and is updated daily on week days.
Initial download of the metrics may take a while.