Fig. 8
Download original image
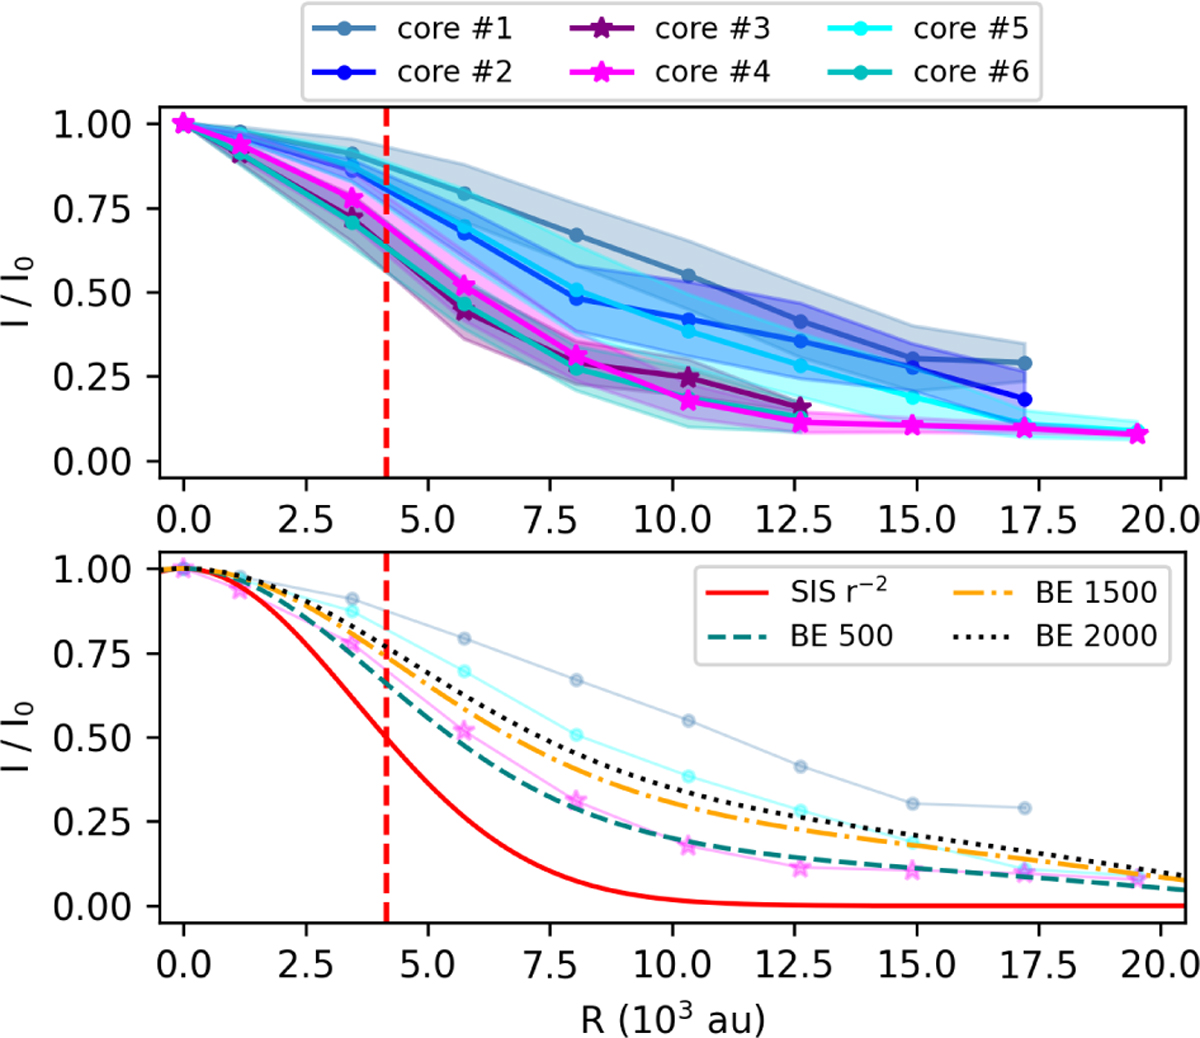
Upper panel: radial profile of the emission of cores #1 to #6 in the ALMA 219 GHz 7M+TM2 continuum images. Lower panel: radial profile of the emission expected from isothermal cores with a known radial density distribution observed with the resolution of ALMA 219 GHz 7M+TM2 data. We report the observed profiles of cores #1, #4, and #5 for visual comparison. The dashed vertical red line indicates the beam half width at half maximum of the 219 GHz continuum data.
Current usage metrics show cumulative count of Article Views (full-text article views including HTML views, PDF and ePub downloads, according to the available data) and Abstracts Views on Vision4Press platform.
Data correspond to usage on the plateform after 2015. The current usage metrics is available 48-96 hours after online publication and is updated daily on week days.
Initial download of the metrics may take a while.