Fig. 6
Download original image
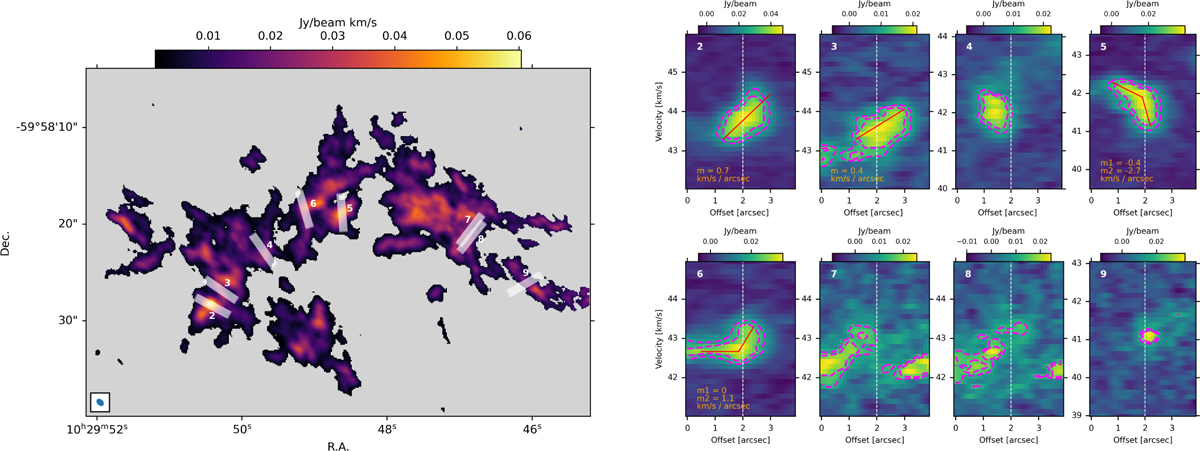
Left panel: moment-0 maps of DCO+(2–1) with shown in white the cuts for the PV plots, centered at the peak positions of the cores. Right panels: PV plots for each core in the arch. The vertical white line delimits the position of the peak of the core. The dashed magenta line delimits the contours where the emission is half and two thirds of the maximum.
Current usage metrics show cumulative count of Article Views (full-text article views including HTML views, PDF and ePub downloads, according to the available data) and Abstracts Views on Vision4Press platform.
Data correspond to usage on the plateform after 2015. The current usage metrics is available 48-96 hours after online publication and is updated daily on week days.
Initial download of the metrics may take a while.