Fig. 4
Download original image
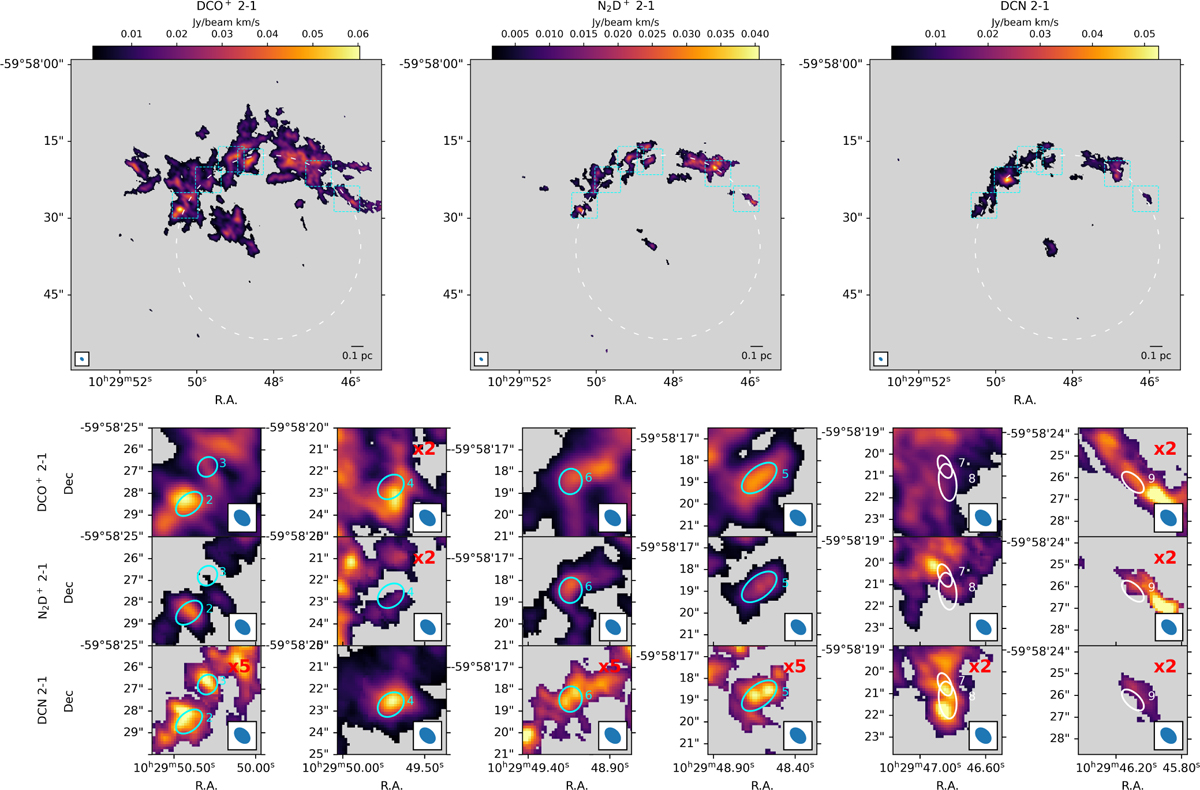
Top panel: moment-0 map of DCO+(2–1) (left), N2D+(2–1) (middle), and DCN (2–1) (right). Bottom panels: zooms-in of the three moment-0 maps in the boxes delimited in cyan in the upper panels. The cyan and white ellipses identify the compact cores extracted with CuTEx from the ALMAGAL 7M+TM2 continuum and ALMA Band 4 continuum, respectively. Some of the zoom-in boxes have the intensity multiplied by a factor reported in red in the top right corner of the box, to highlight the emission with respect to the color scale adopted for the full maps.
Current usage metrics show cumulative count of Article Views (full-text article views including HTML views, PDF and ePub downloads, according to the available data) and Abstracts Views on Vision4Press platform.
Data correspond to usage on the plateform after 2015. The current usage metrics is available 48-96 hours after online publication and is updated daily on week days.
Initial download of the metrics may take a while.