Fig. 3
Download original image
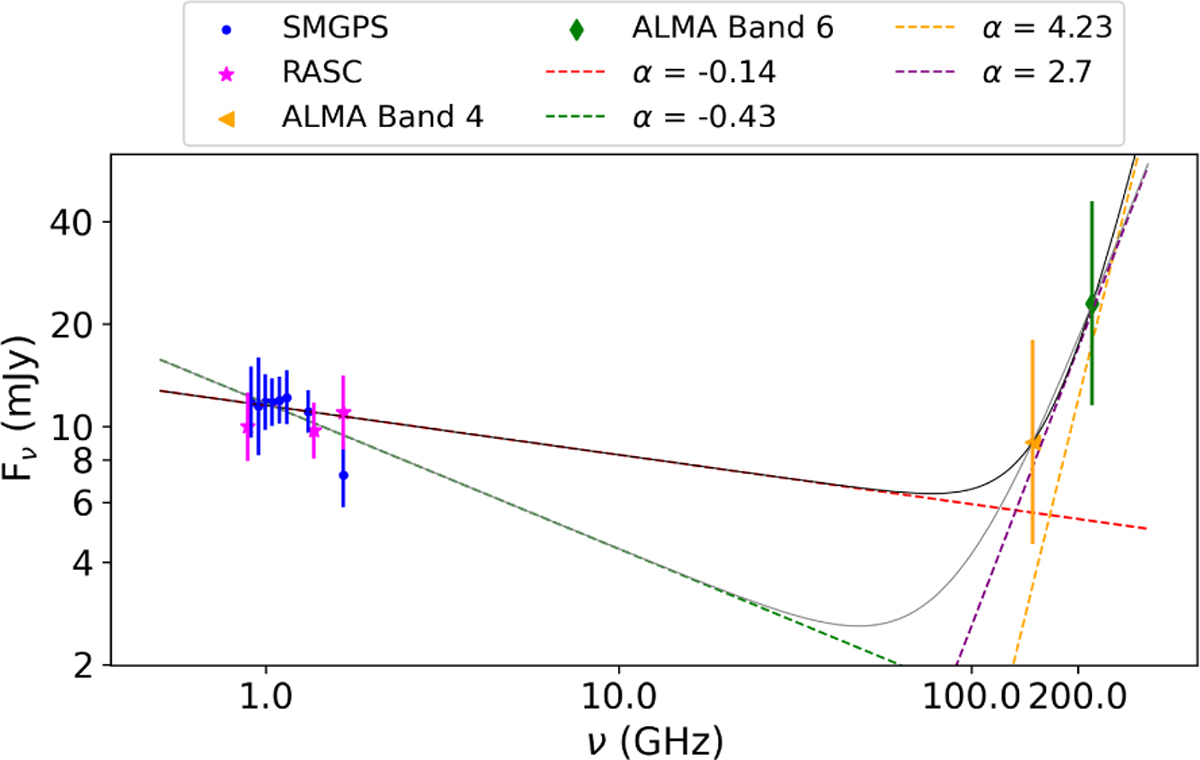
Spectral energy distribution of the radio emission between 0.88 GHz and 219 GHz from SMGPS, RACS, ALMAGAL, and the new data presented in this paper. The dashed green line is the best linear fit between 0.88 and 1.65 GHz including all the data points; the dashed red line is the best linear fit between 0.88 and 1.65 GHz if the SMGPS point at 1.65 GHz is removed; the dashed purple line is the best fit of the 150 and 219 GHz flux, after removing the free-free contamination assuming the green fit; and the dashed yellow line is the same as the purple one, but calculating the free-free contamination using the dashed red line.
Current usage metrics show cumulative count of Article Views (full-text article views including HTML views, PDF and ePub downloads, according to the available data) and Abstracts Views on Vision4Press platform.
Data correspond to usage on the plateform after 2015. The current usage metrics is available 48-96 hours after online publication and is updated daily on week days.
Initial download of the metrics may take a while.