Open Access
Fig. D.1
Download original image
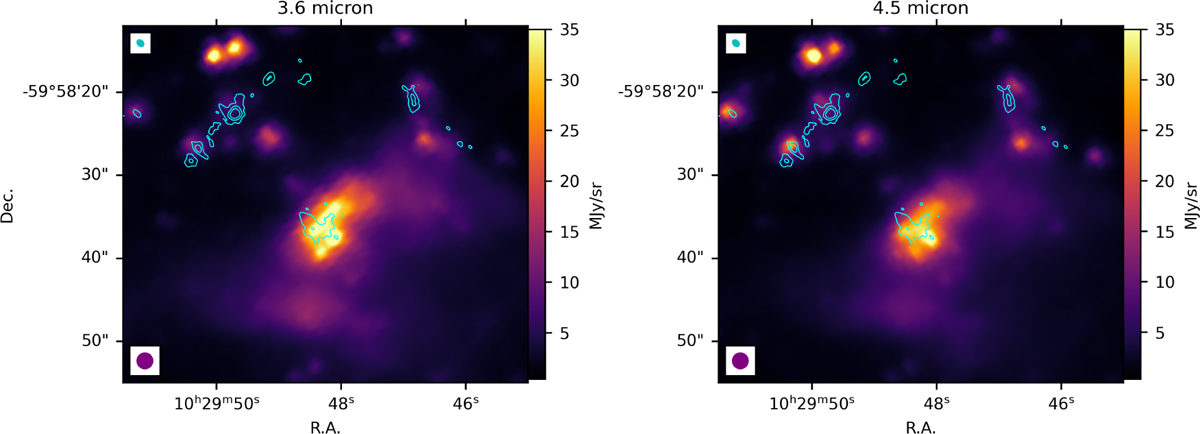
Emission at the coordinates of source AG286.0716–1.8229 in IRAC band 1 and band 2. The cyan contours are the contour of the continuum emission in ALMA Band 4 (4, 10, and 20 times the rms). The IRAC beam is shown in the bottom-left corner in purple, while the ALMA Band 4 beam is shown in cyan in the upper-left corner.
Current usage metrics show cumulative count of Article Views (full-text article views including HTML views, PDF and ePub downloads, according to the available data) and Abstracts Views on Vision4Press platform.
Data correspond to usage on the plateform after 2015. The current usage metrics is available 48-96 hours after online publication and is updated daily on week days.
Initial download of the metrics may take a while.