Fig. 1
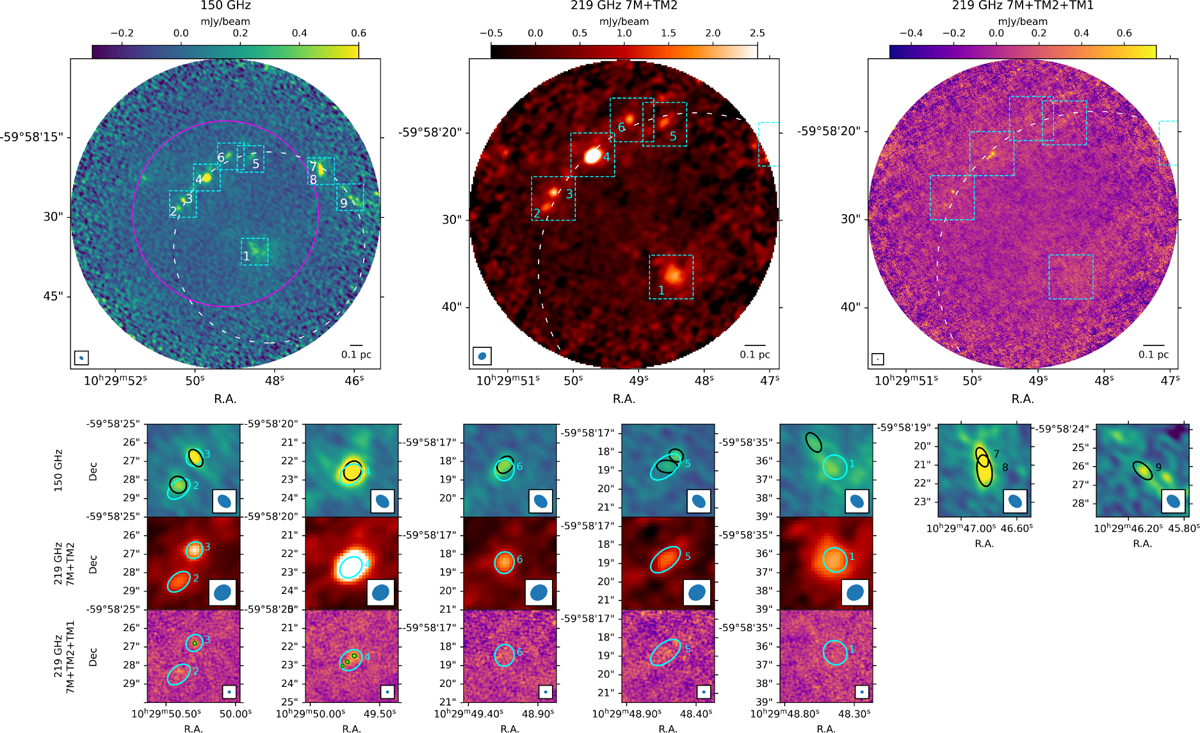
Download original image
Top left panel: continuum emission at 150 GHz; the magenta circle represents the FoV of the ALMAGAL observations, while the dashed white circle visually represent the arch-shaped region where the continuum cores are detected. Top middle panel: ALMAGAL 7M+TM2 continuum emission; the cyan boxes are the footprint of the zoom-ins in the lower panels. Top right panel: ALMAGAL 7M+TM2+TM1 continuum emission. The dashed white circle in all the three top panels visually represents the 0.75 pc radius circle along which all cores, except core #1, are aligned. Lower panel: zoom-ins of the regions delimited in cyan in the top middle panel, where we kept the same color scale for the three different datasets. The cyan ellipses represent the compact sources identified with CuTEx in the ALMAGAL 7M+TM2 data, with their identification number reported in cyan, while the black ellipses and the green ellipses are the compact sources identified with CuTEx in the ALMA Band 4 data and the ALMAGAL 7M+TM2+TM1 data, respectively.
Current usage metrics show cumulative count of Article Views (full-text article views including HTML views, PDF and ePub downloads, according to the available data) and Abstracts Views on Vision4Press platform.
Data correspond to usage on the plateform after 2015. The current usage metrics is available 48-96 hours after online publication and is updated daily on week days.
Initial download of the metrics may take a while.