Open Access
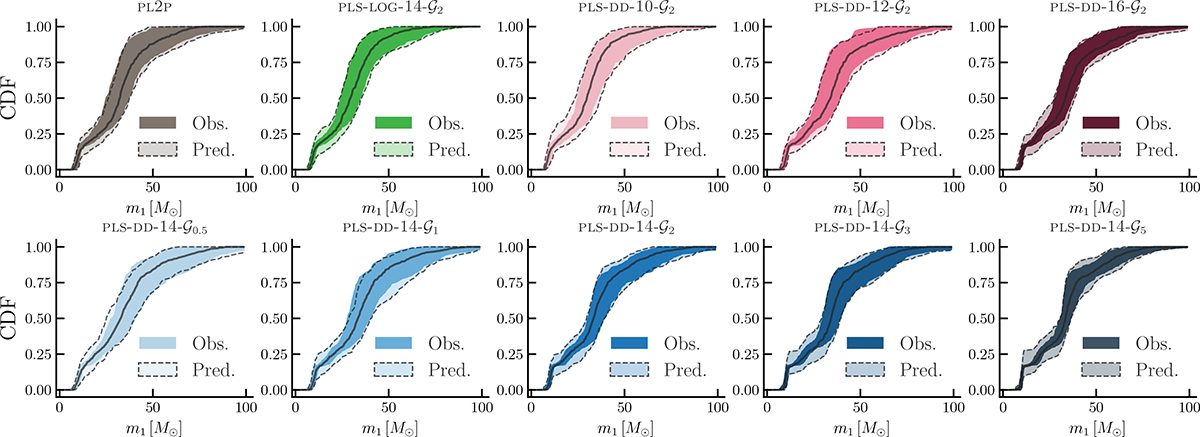
Fig. A.2.
Download original image
Posterior predictive check for all the models tested in this work. In darker colors are shown the observed cumulative distribution of the BBH population, while in lighter colors the predicted one, given the considered models (reported at the top of each panel). Solid black lines are the medians of the predicted CDFs of m1.
Current usage metrics show cumulative count of Article Views (full-text article views including HTML views, PDF and ePub downloads, according to the available data) and Abstracts Views on Vision4Press platform.
Data correspond to usage on the plateform after 2015. The current usage metrics is available 48-96 hours after online publication and is updated daily on week days.
Initial download of the metrics may take a while.