Fig. 3.
Download original image
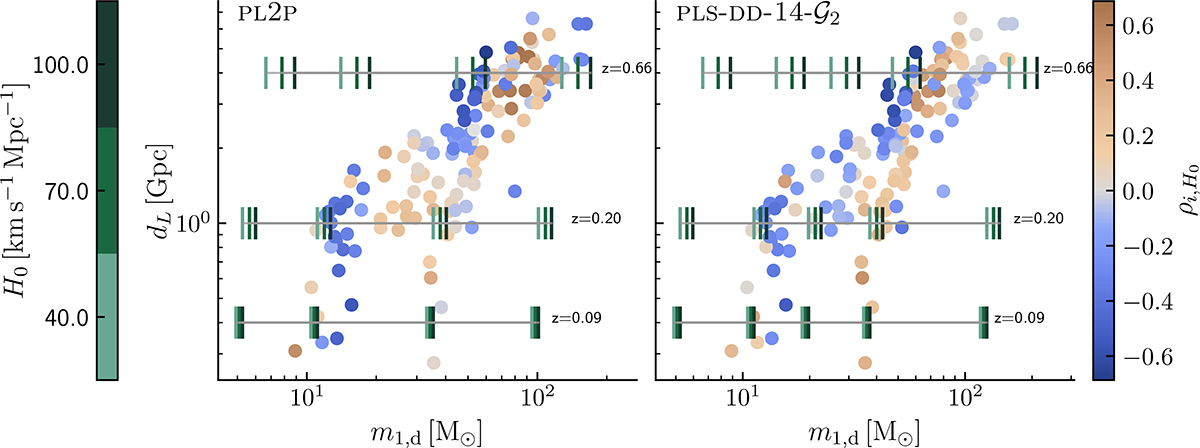
Events of GWTC-4 plotted in the m1, d − dL plane, colored according to the Spearman coefficient between H0 and their single-event marginalized likelihood with two different mass models. The ticks represent the MD features of the different models (minimum and maximum mass, as well as the position of the main peaks), plotted at different dL and H0 values, as indicated by the green color scale. The luminosity distance values correspond to redshifts 0.09, 0.2, and 0.66 in a flat ΛCDM cosmology with H0 = 70 km s−1 Mpc and Ωm, 0 = 0.3.
Current usage metrics show cumulative count of Article Views (full-text article views including HTML views, PDF and ePub downloads, according to the available data) and Abstracts Views on Vision4Press platform.
Data correspond to usage on the plateform after 2015. The current usage metrics is available 48-96 hours after online publication and is updated daily on week days.
Initial download of the metrics may take a while.