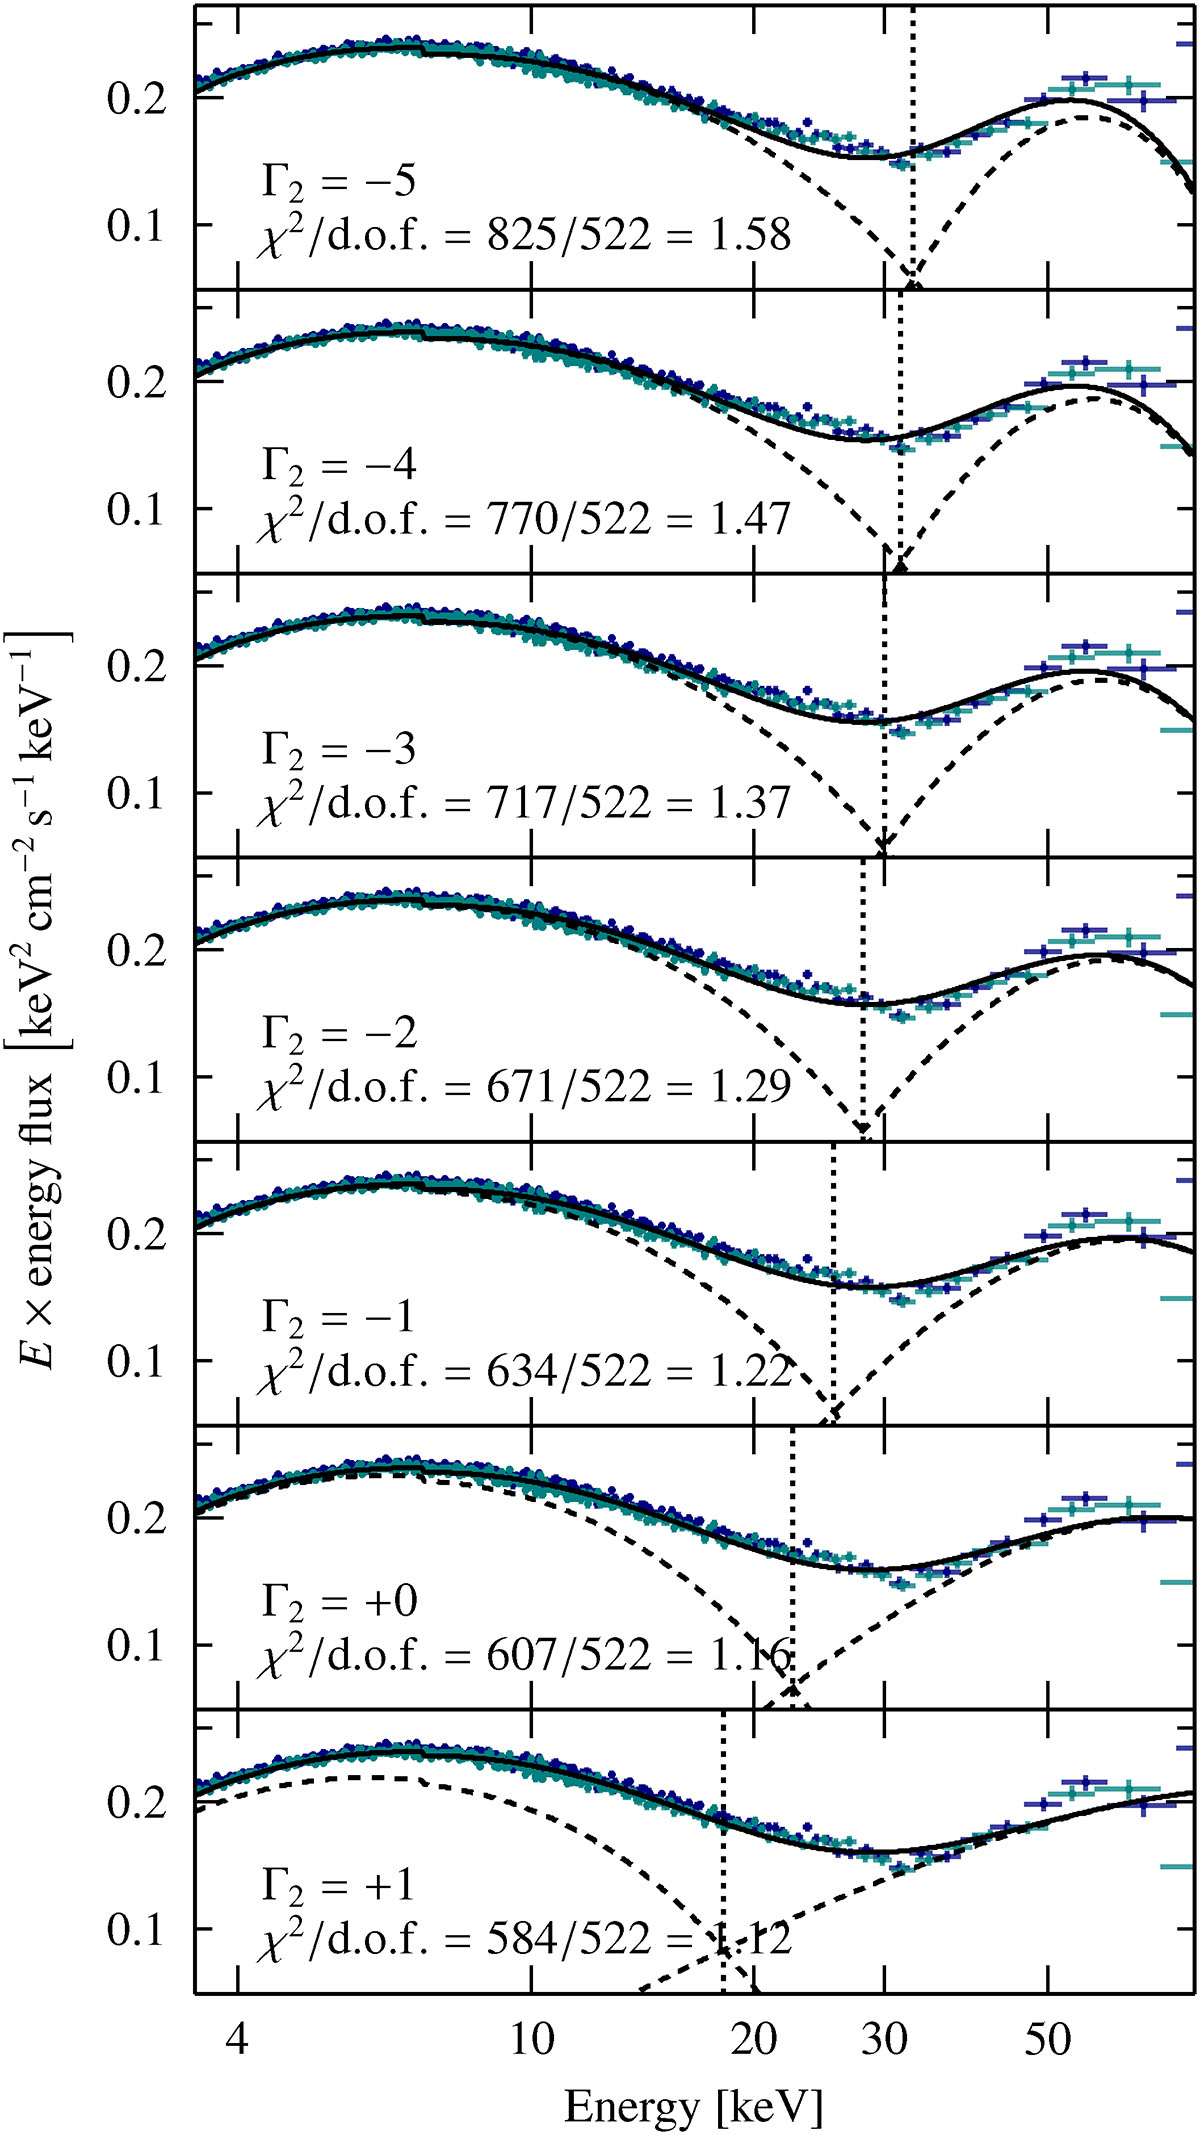
Fig. 8.
Download original image
Impact of Γ2 on spectral modeling. Each panel shows a fit to the X-ray spectrum of X Per (shown in blue and teal) with Γ2 fixed to the values given in the panels. The solid line shows the best-fit model, the dashed lines indicate the two model components, the vertical dotted lines indicate the resulting intersection energy. The χ2 statistic is given in each panel.
Current usage metrics show cumulative count of Article Views (full-text article views including HTML views, PDF and ePub downloads, according to the available data) and Abstracts Views on Vision4Press platform.
Data correspond to usage on the plateform after 2015. The current usage metrics is available 48-96 hours after online publication and is updated daily on week days.
Initial download of the metrics may take a while.