Fig. 7.
Download original image
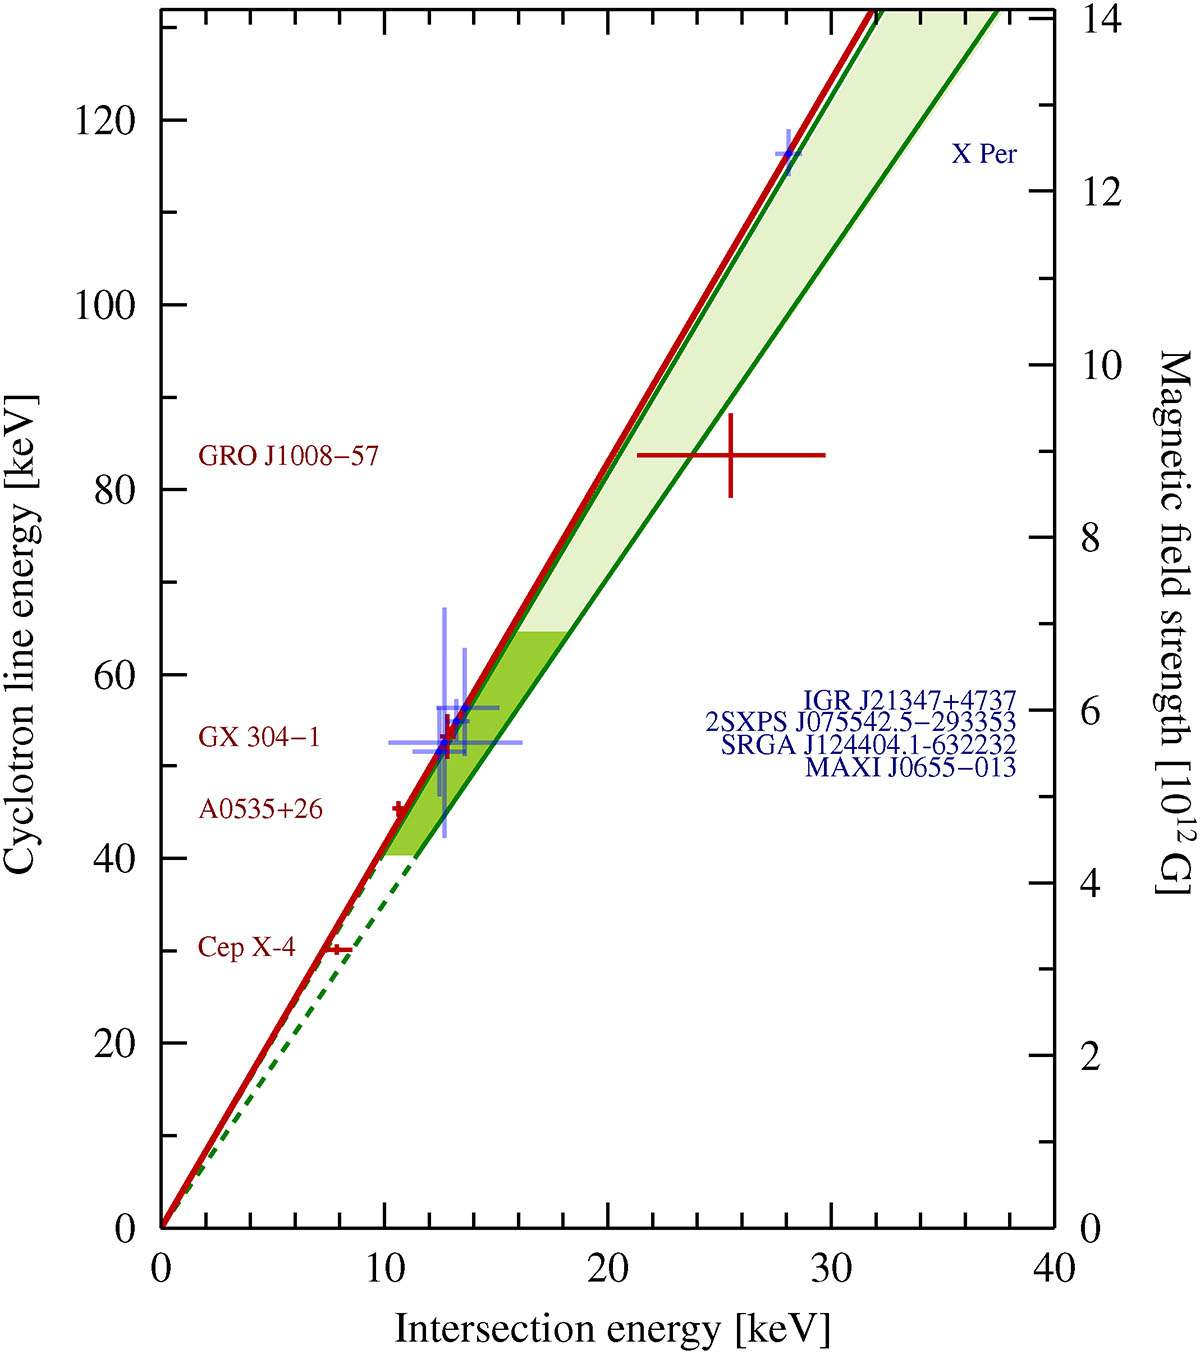
Relation between magnetic field strength and intersection energy. Shown in red are the data points from real observations with the corresponding source names given on the left y-axis. The red line indicates the linear relation found in Sect. 2.4. The blue data points indicate the predicted magnetic field strengths for those BeXRBs without known magnetic field strength. Their names are given on the right y-axis. The solid green lines are obtained from the simulation-driven approach and resemble the left and right boundaries of the parameter space; the dashed green line show the behavior toward low B-field strengths, for which the polcap is not applicable due to spectral redistribution due to Landau excitations. The dark green area indicates the B-field range from which the green lines are obtained from; the light green area shows the extrapolation of the dark green area toward higher B-field strengths.
Current usage metrics show cumulative count of Article Views (full-text article views including HTML views, PDF and ePub downloads, according to the available data) and Abstracts Views on Vision4Press platform.
Data correspond to usage on the plateform after 2015. The current usage metrics is available 48-96 hours after online publication and is updated daily on week days.
Initial download of the metrics may take a while.