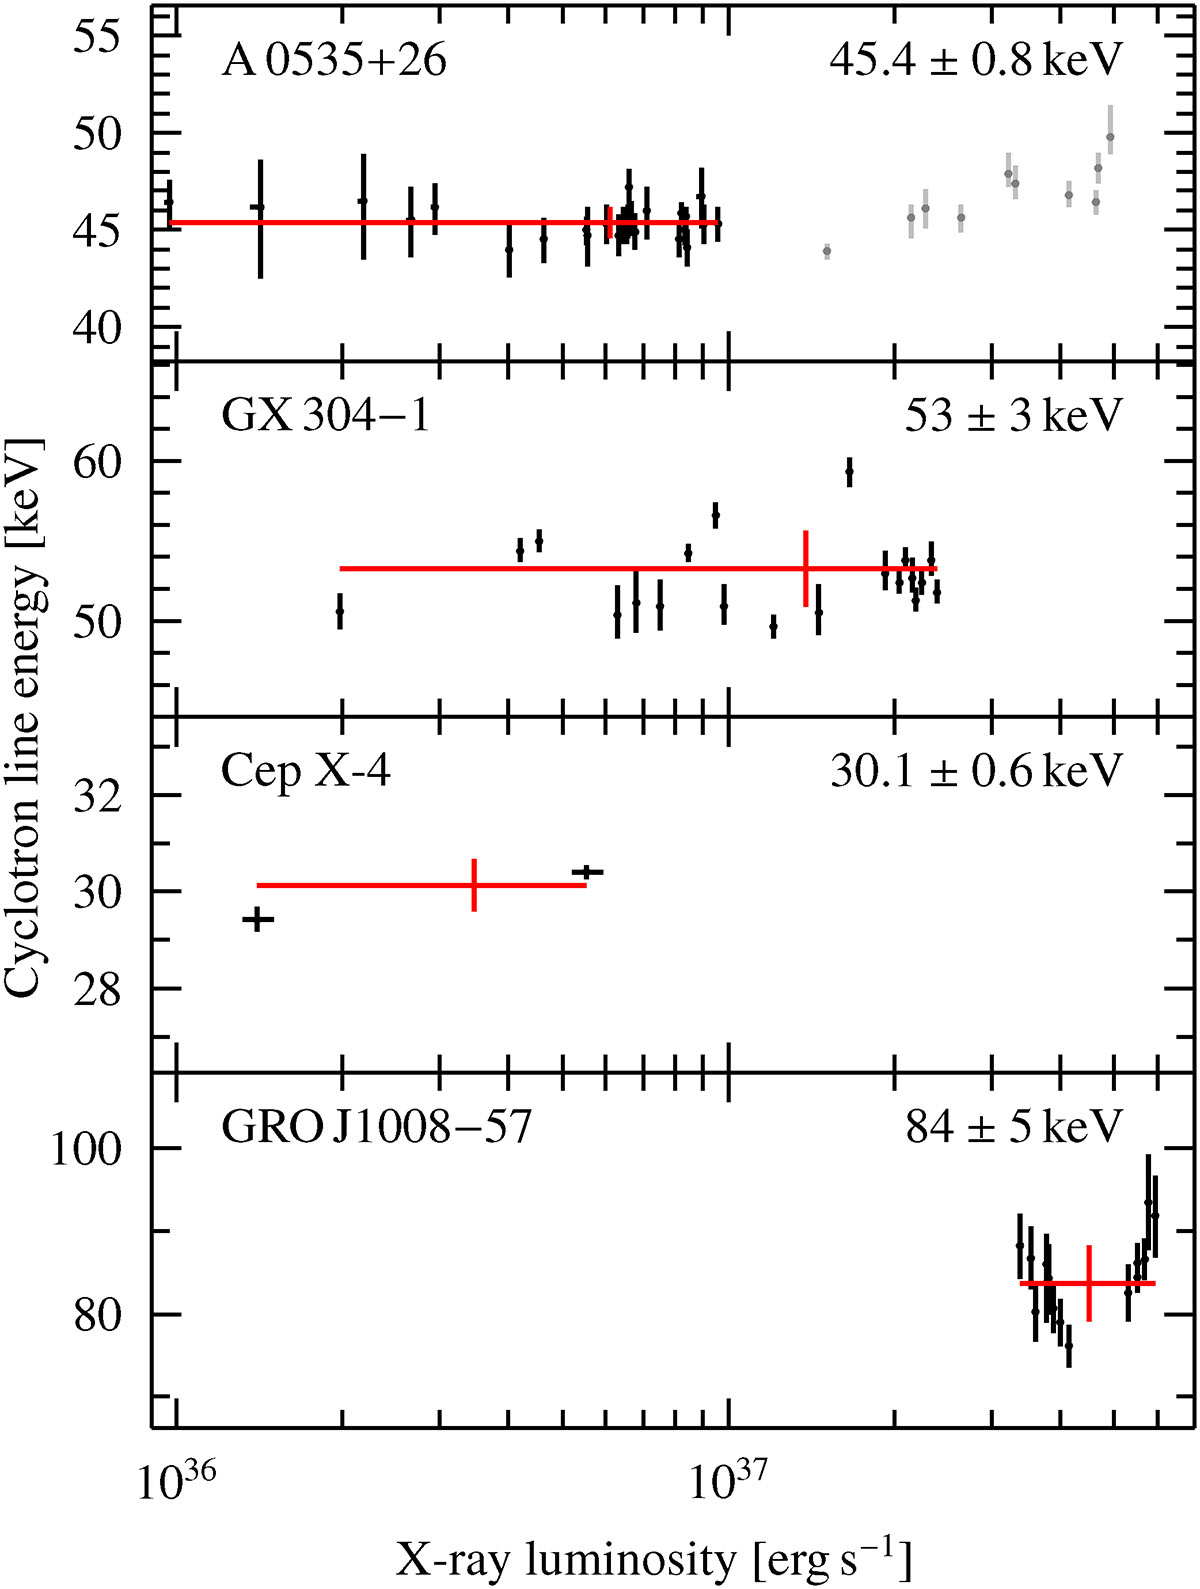
Fig. 3.
Download original image
Observed cyclotron line energy as a function of X-ray luminosity. Red data points denote the inverse-variance weighted average of the cyclotron line energy. Gray data points have been excluded from the averaging. The data for the top three panels have been collected by Staubert et al. (2019) and stem from Caballero et al. (2007), Sartore et al. (2015) and Fürst et al. (2015). The data for the bottom panel have been directly obtained from Chen et al. (2021).
Current usage metrics show cumulative count of Article Views (full-text article views including HTML views, PDF and ePub downloads, according to the available data) and Abstracts Views on Vision4Press platform.
Data correspond to usage on the plateform after 2015. The current usage metrics is available 48-96 hours after online publication and is updated daily on week days.
Initial download of the metrics may take a while.