Fig. 2.
Download original image
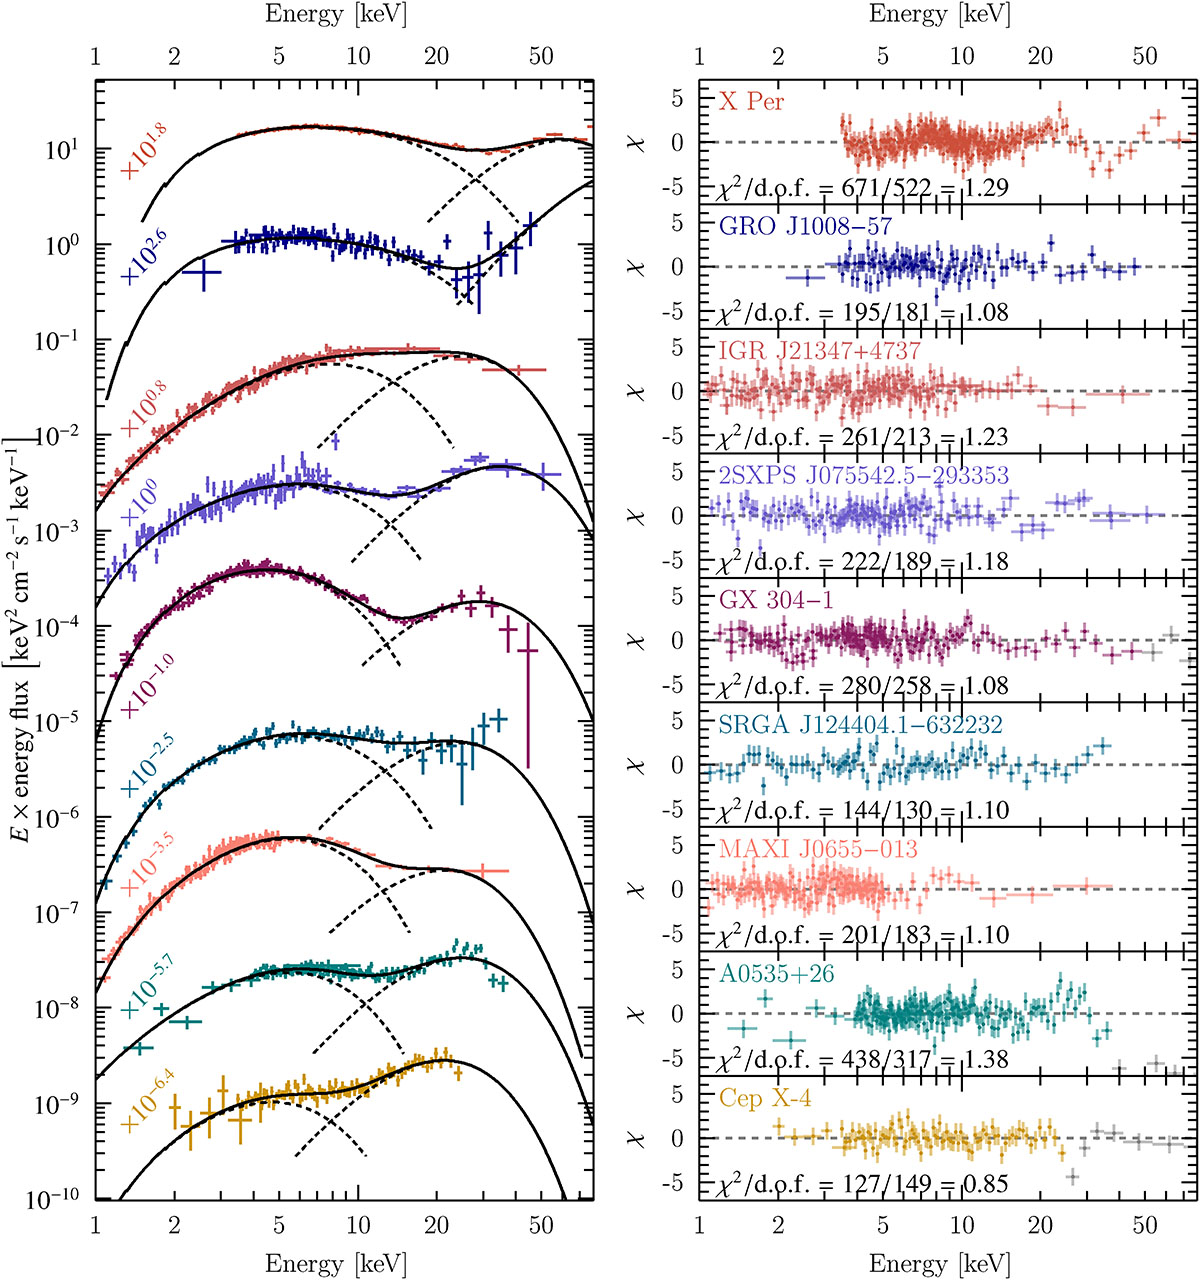
Spectral fit of the doublehump model to quiescent X-ray spectra of nine BeXRBs. Left panel: Unfolded E × FE spectra and fit model (solid line); the dashed lines indicate the two components of the doublehump model. The spectra are separated vertically for improved perceptibility, ordered by descending intersection energy from top to bottom, and to this end have been rescaled by the factors given on the left y-axis of the left panel. The spectra have also been rescaled to match NuSTAR/FPMA according to the cross-calibration constants. Right panel: χ residuals of spectral fits for each source, respectively. The gray residuals indicate data points that were not used for spectral fitting, as they are at or above the CRSF feature, which is not part of the doublehump model and therefore excluded. The spectra have been rebinned and the NuSTAR FPMs combined for visual purposes.
Current usage metrics show cumulative count of Article Views (full-text article views including HTML views, PDF and ePub downloads, according to the available data) and Abstracts Views on Vision4Press platform.
Data correspond to usage on the plateform after 2015. The current usage metrics is available 48-96 hours after online publication and is updated daily on week days.
Initial download of the metrics may take a while.