Open Access
Fig. 6.
Download original image
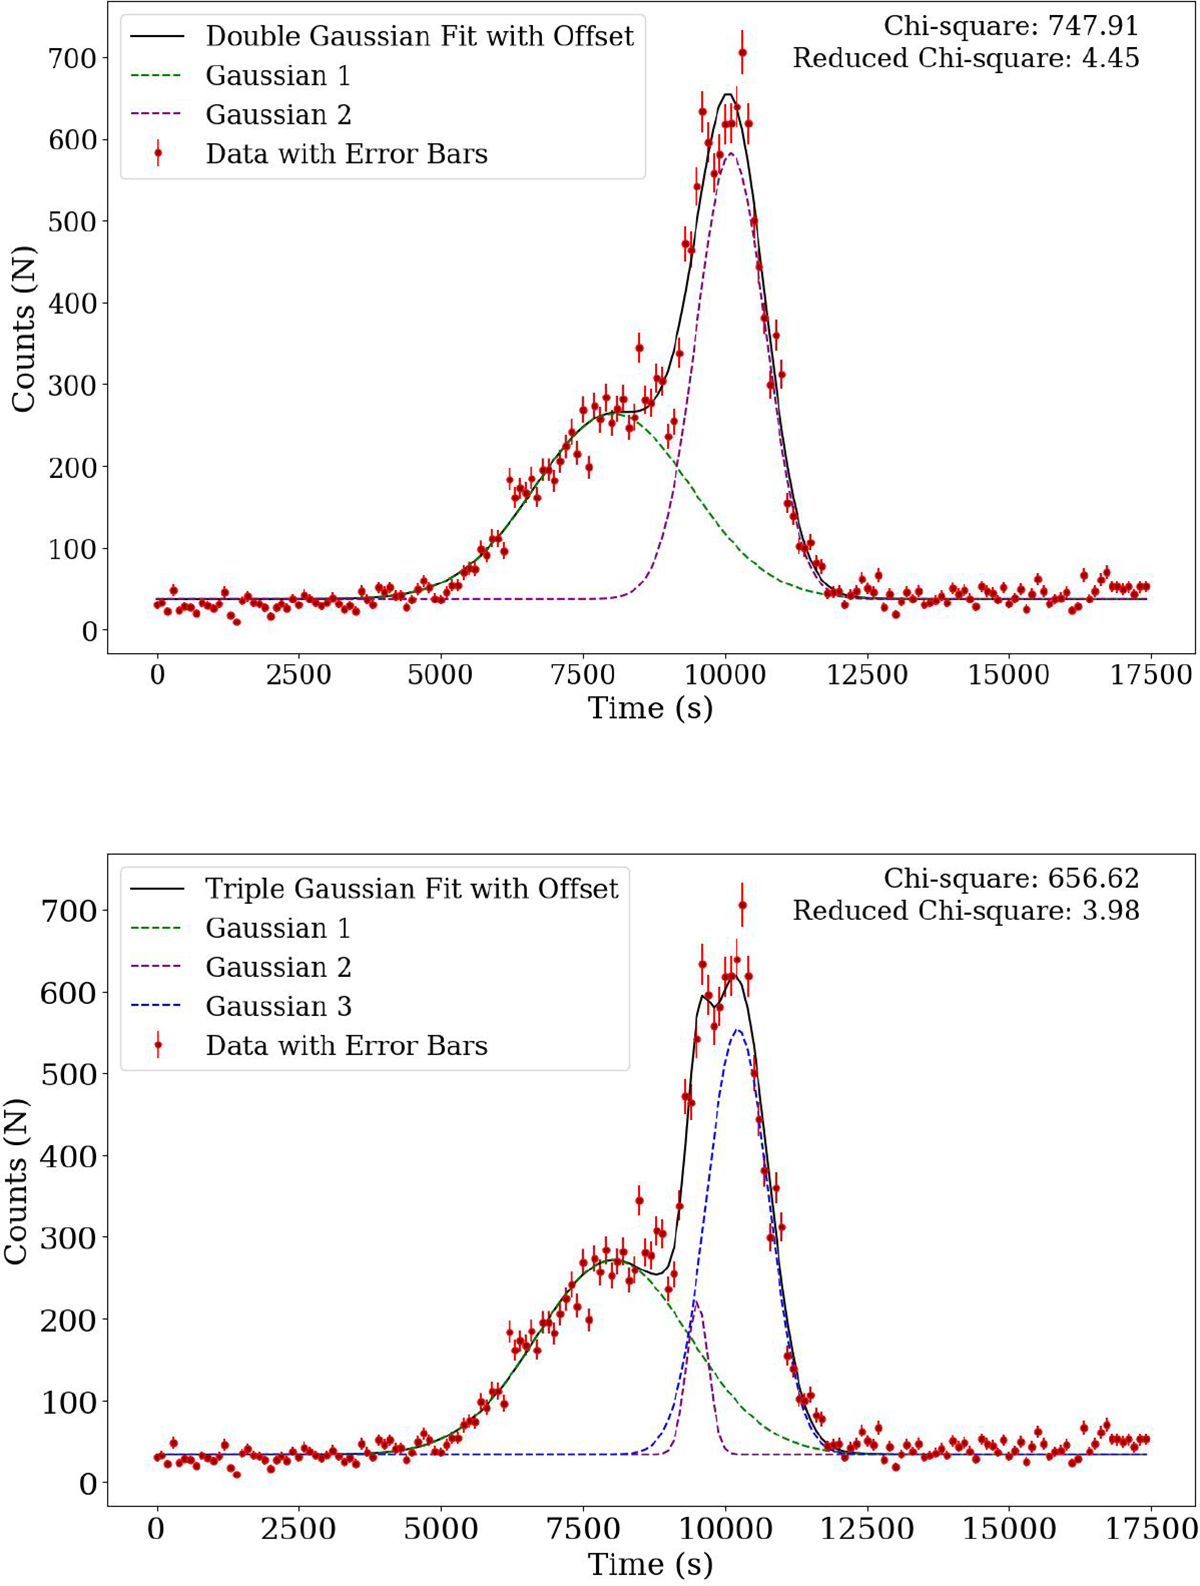
Double-Gaussian (top) and three-Gaussian (bottom) fits to the summed light curve (counts vs time) of the August 31, 2019, Sgr A* flare. Time zero corresponds to the start of the observation (Table A.1).
Current usage metrics show cumulative count of Article Views (full-text article views including HTML views, PDF and ePub downloads, according to the available data) and Abstracts Views on Vision4Press platform.
Data correspond to usage on the plateform after 2015. The current usage metrics is available 48-96 hours after online publication and is updated daily on week days.
Initial download of the metrics may take a while.