


Fig. 9.
Download original image
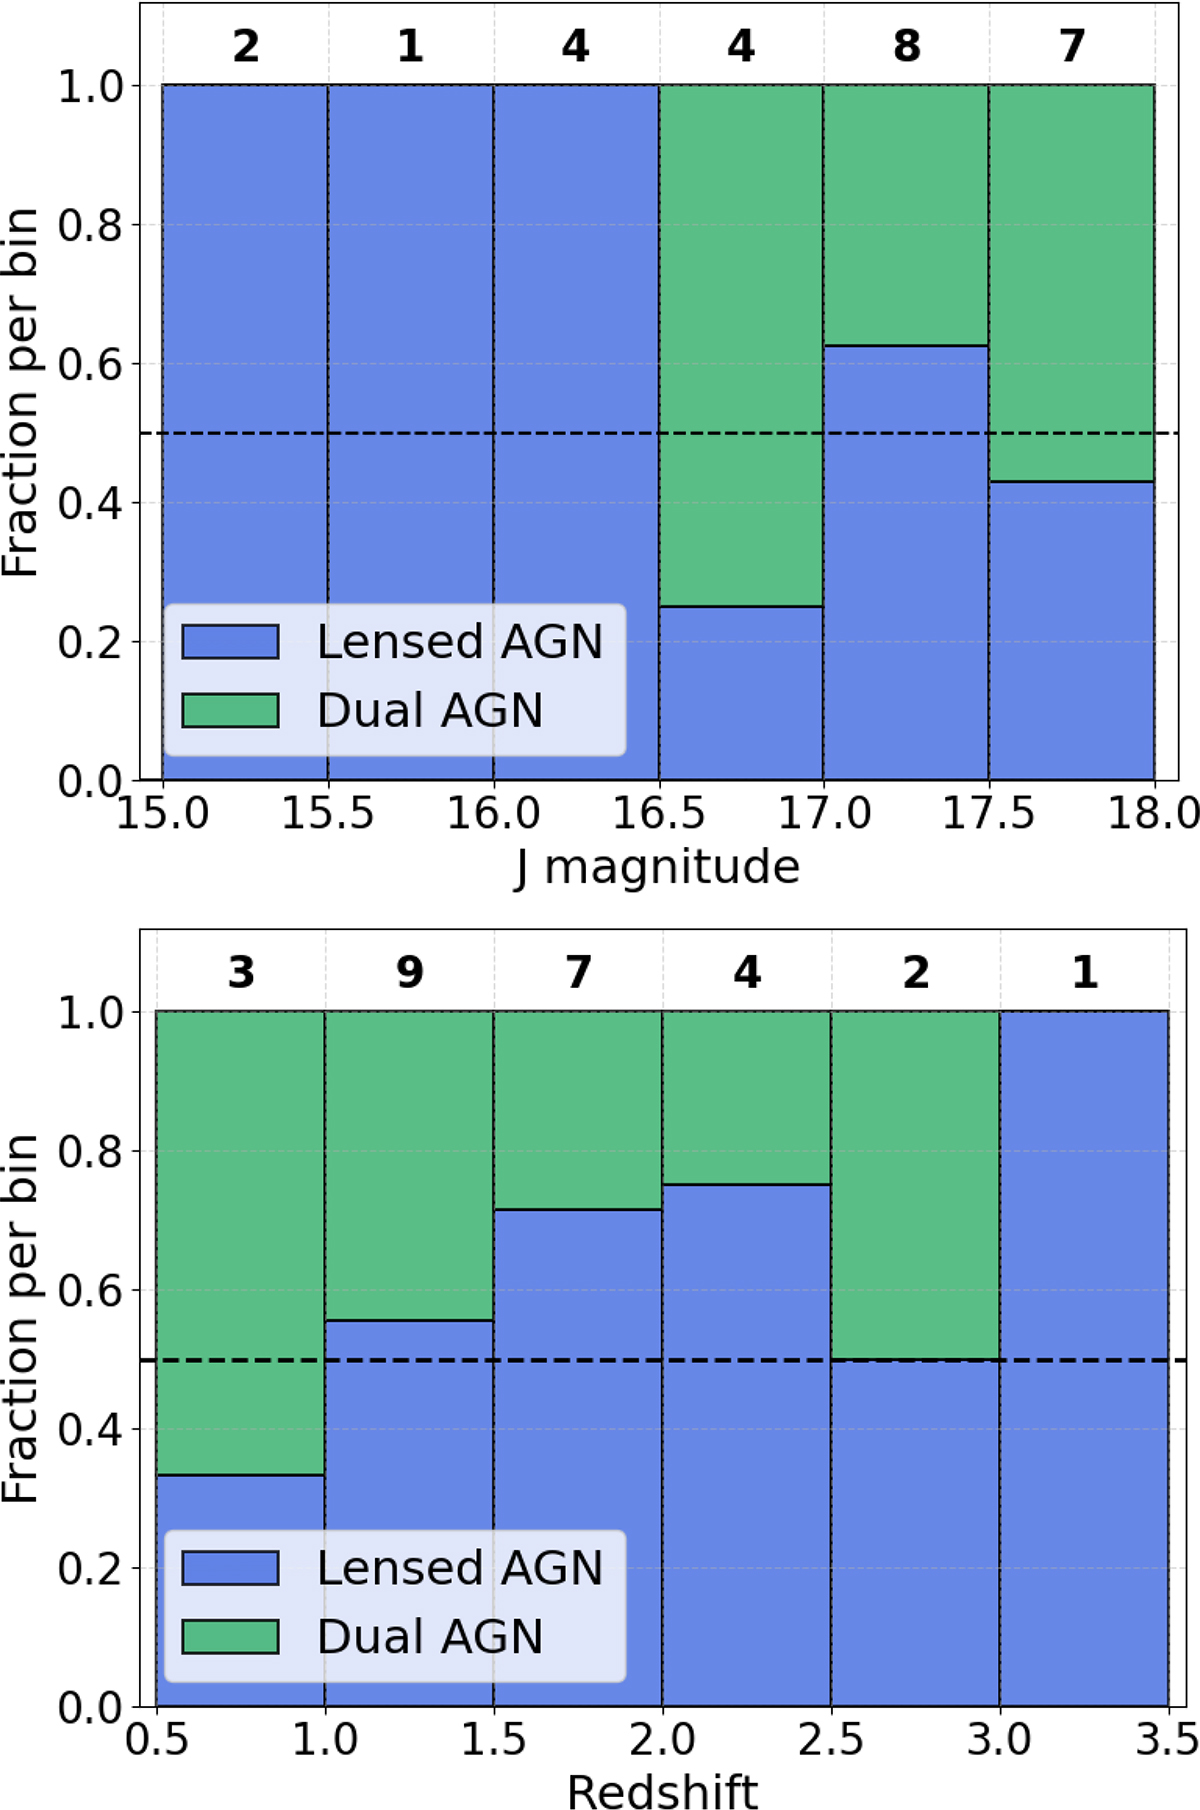
Top panel: Fraction of lensed systems (blue) and dual AGN (green) as a function of J-band magnitude for the MUSE sample (this work and Scialpi et al. 2024). Bottom panel: Same but as a function of redshift. Data are binned in intervals of 0.5 mag (top) and 0.5 (bottom). The number above each column indicates the total number of objects in that bin. The horizontal dashed line marks the 50% level for reference.
Current usage metrics show cumulative count of Article Views (full-text article views including HTML views, PDF and ePub downloads, according to the available data) and Abstracts Views on Vision4Press platform.
Data correspond to usage on the plateform after 2015. The current usage metrics is available 48-96 hours after online publication and is updated daily on week days.
Initial download of the metrics may take a while.