


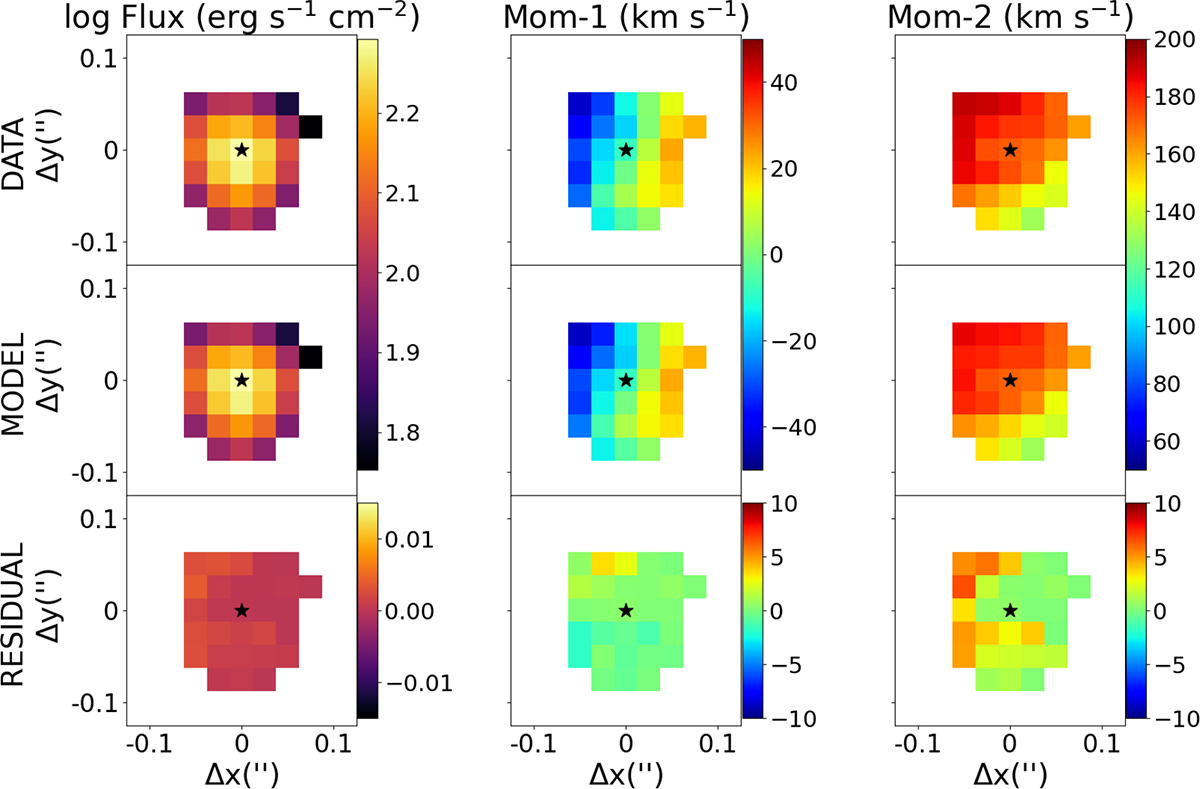
Fig. 8.
Download original image
MOKA3D rotating disk best-fit model of J0957−2242 traced by the [O III]5007 transition. Panels show the observed (top), best-fit (center), and residual (bottom) moment maps. The residual maps were obtained by subtracting the model from the observed moment maps. The star marks the kinematic center, inferred as the peak flux emission. Pixels are masked at SN ≤ 4.
Current usage metrics show cumulative count of Article Views (full-text article views including HTML views, PDF and ePub downloads, according to the available data) and Abstracts Views on Vision4Press platform.
Data correspond to usage on the plateform after 2015. The current usage metrics is available 48-96 hours after online publication and is updated daily on week days.
Initial download of the metrics may take a while.