


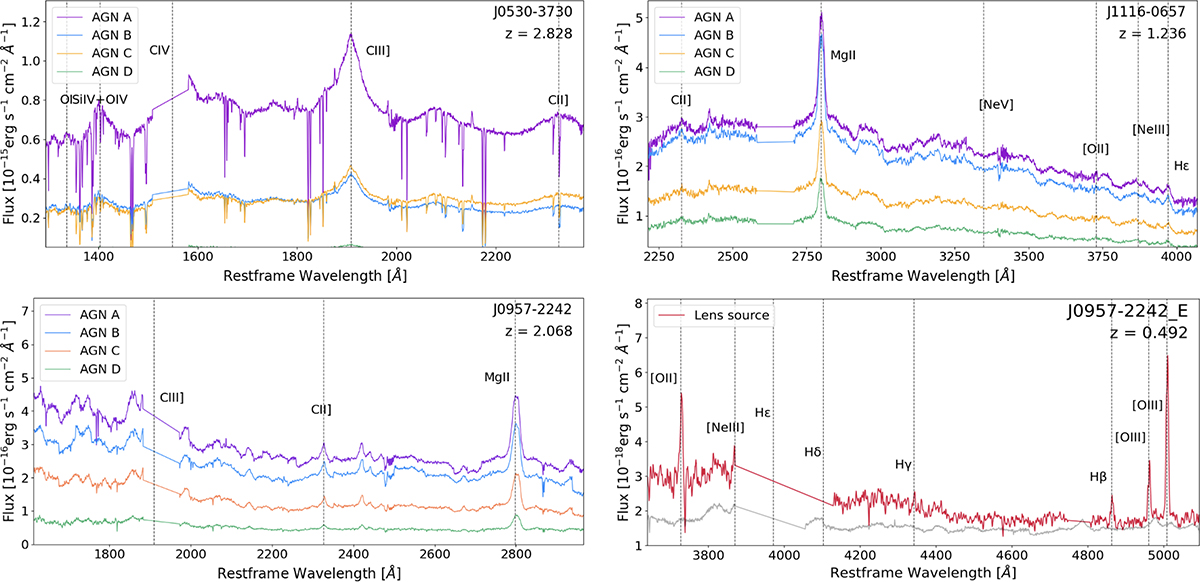
Fig. A.3.
Download original image
Final MUSE spectra for the three quadruply imaged AGN systems. For each system, the four AGN images are shown in different colors, following the same color-coding adopted in Fig. 3. The top row shows the first two quadruple systems, while the bottom-left panel shows the four AGN spectra of J0957. All spectra are corrected for Galactic extinction, normalized to Gaia photometry, and shifted to the rest frame. Vertical blue dashed lines mark the wavelengths of the main emission lines. Since J0957 data also allowed us to identify the foreground lensing galaxy, its spectrum (component E) is shown separately in red in the bottom-right panel. For reference, the AGN spectrum that contaminates the lens is shown in gray, while the emission lines of the lensing galaxy are indicated by black vertical dotted lines.
Current usage metrics show cumulative count of Article Views (full-text article views including HTML views, PDF and ePub downloads, according to the available data) and Abstracts Views on Vision4Press platform.
Data correspond to usage on the plateform after 2015. The current usage metrics is available 48-96 hours after online publication and is updated daily on week days.
Initial download of the metrics may take a while.