


Fig. A.1.
Download original image
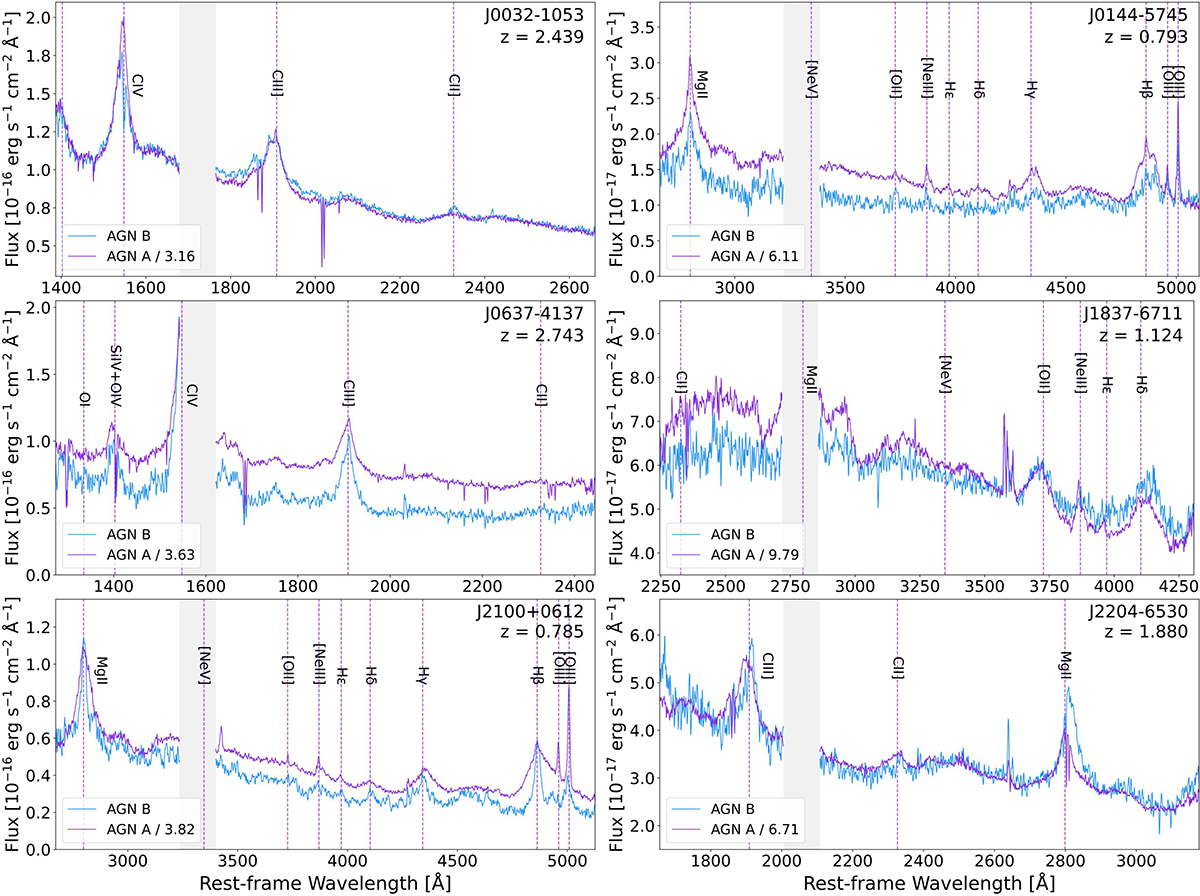
Final MUSE spectra of the dual AGN systems, with target names and redshifts indicated in each panel. The spectra were extracted from the circular apertures shown in Fig. 2 (same color-coding), corrected for Galactic extinction, normalized to Gaia magnitudes, and shifted to the rest frame. For clarity, the spectra of the primary AGN (component A) have been re-normalized to facilitate comparison with those of component B; the applied renormalization factor is indicated in each panel. Vertical dotted purple lines mark the expected positions of prominent emission lines at the redshift of AGN A. The gap around λobs = 6000 Å (observed frame) corresponds to the New Generation Controllers (NGC) used in AO observations.
Current usage metrics show cumulative count of Article Views (full-text article views including HTML views, PDF and ePub downloads, according to the available data) and Abstracts Views on Vision4Press platform.
Data correspond to usage on the plateform after 2015. The current usage metrics is available 48-96 hours after online publication and is updated daily on week days.
Initial download of the metrics may take a while.