Fig. 9.
Download original image
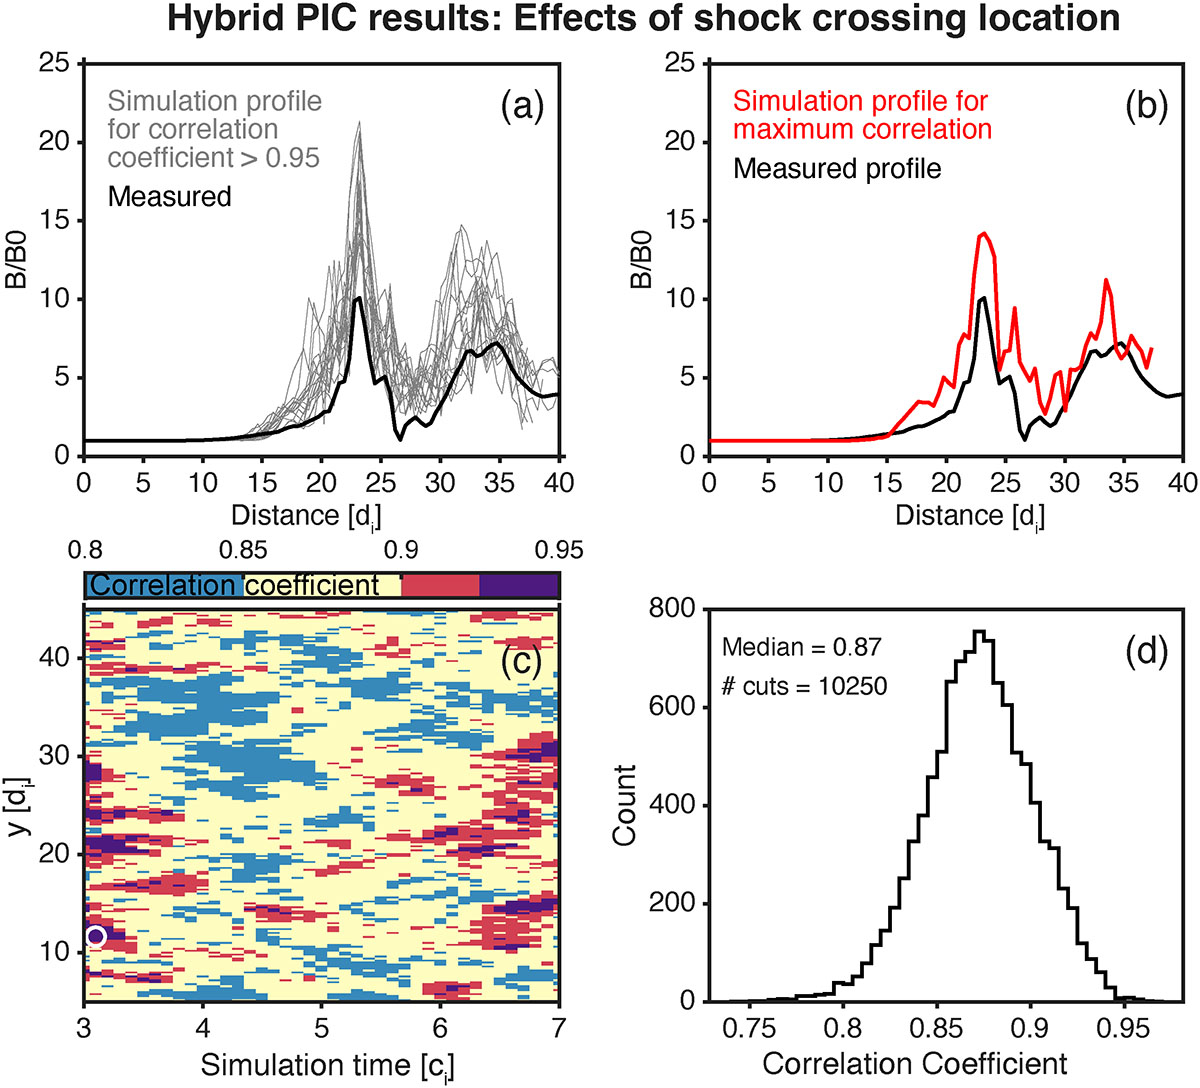
Comparison of optimal simulation profiles. Panel (a): Model cuts with a correlation coefficient above 0.95 and the Solar Orbiter profile. Panel (b): Comparison of the Solar Orbiter profile with the simulation cut with the highest correlation coefficient. Panel (c): Correlation coefficient for each cut at each time, with the best profile location marked by a white O. Panel (d): Histogram of all (10250) computed correlation coefficients.
Current usage metrics show cumulative count of Article Views (full-text article views including HTML views, PDF and ePub downloads, according to the available data) and Abstracts Views on Vision4Press platform.
Data correspond to usage on the plateform after 2015. The current usage metrics is available 48-96 hours after online publication and is updated daily on week days.
Initial download of the metrics may take a while.