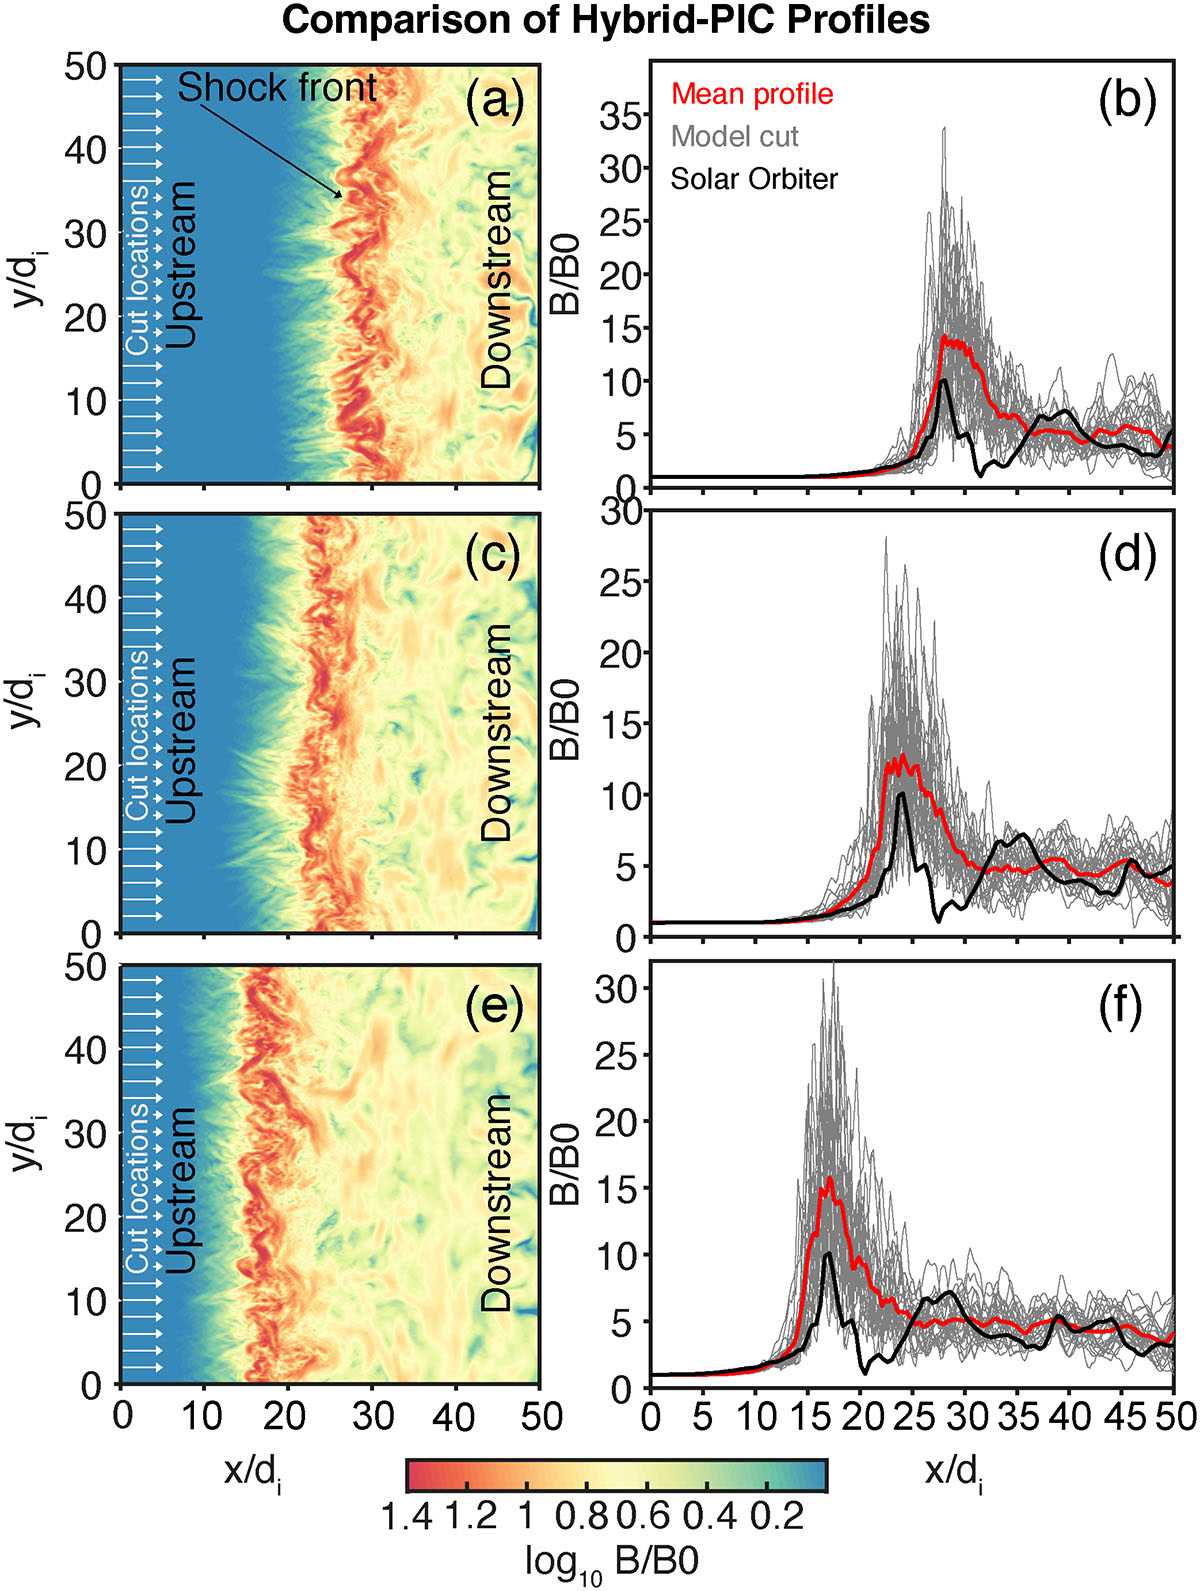
Fig. 8.
Download original image
Comparison of simulation cuts and the Solar Orbiter shock profile for various times. Panel (a) shows the simulation magnetic field strength for t = 30 and the horizontal lines on the left show the y values where the cuts in panel (b) are taken. The red, grey, and black curves in panel (b) indicate the mean simulation profile, individual model cut, and the Solar Orbiter measured profile. The remaining rows are the same format, but plotted for t = 4, 5, 6 ci. As shown in the left column, the shock in the simulation moves from right to left in the simulation domain.
Current usage metrics show cumulative count of Article Views (full-text article views including HTML views, PDF and ePub downloads, according to the available data) and Abstracts Views on Vision4Press platform.
Data correspond to usage on the plateform after 2015. The current usage metrics is available 48-96 hours after online publication and is updated daily on week days.
Initial download of the metrics may take a while.