Fig. 6.
Download original image
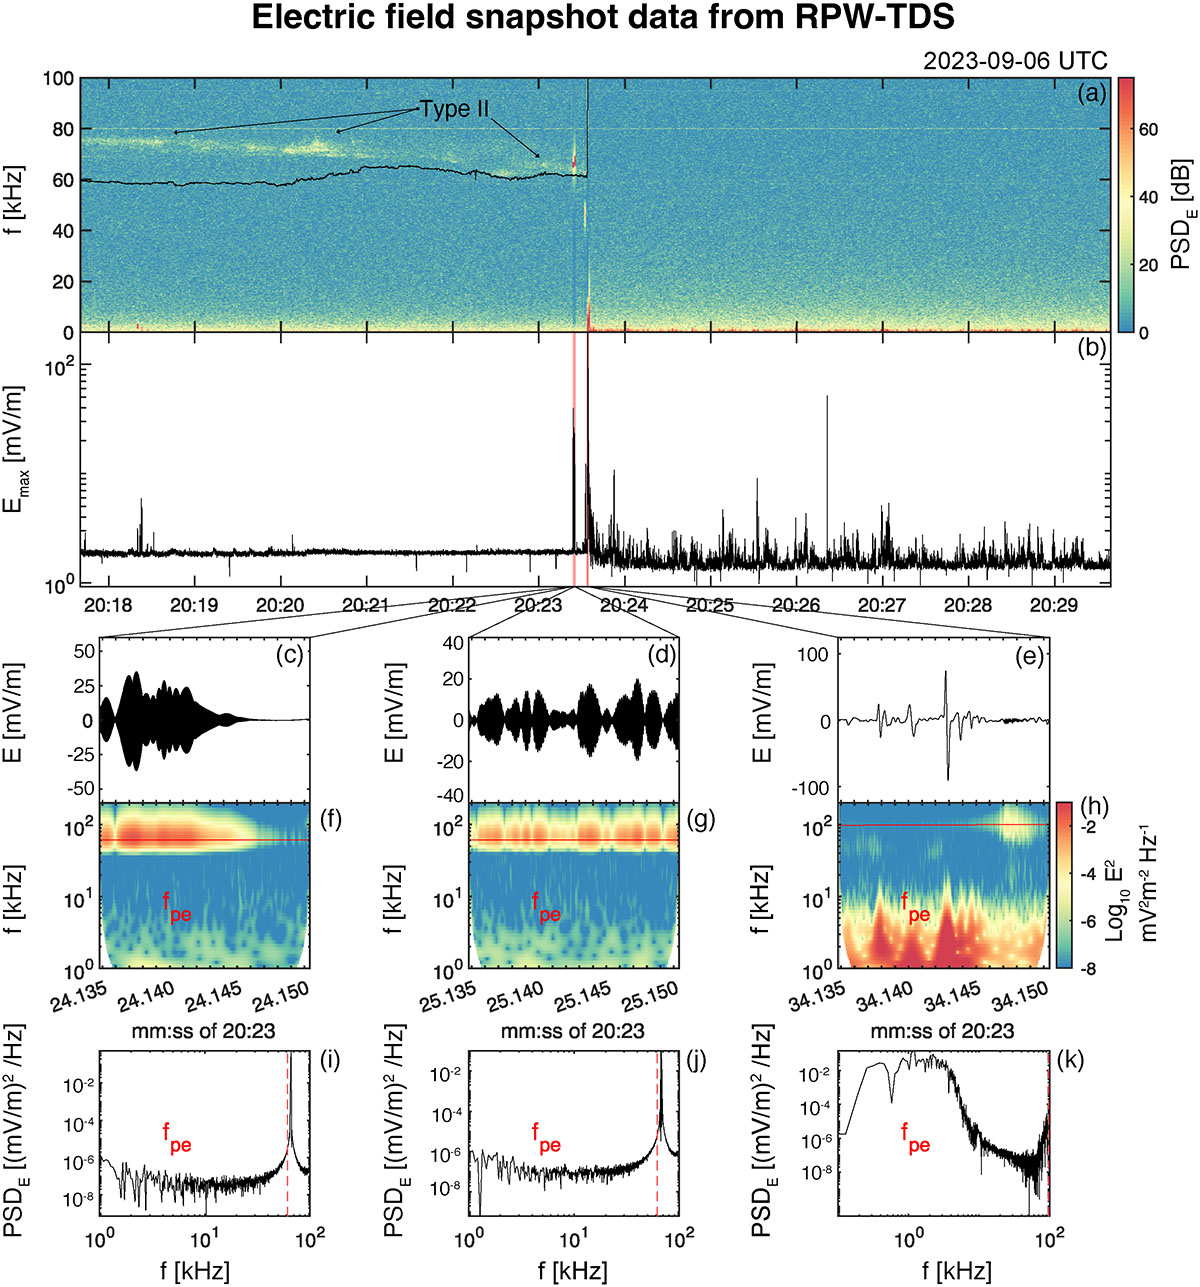
Electric field snapshot data from RPW-TDS. (a) PSD of the SBM1 regular snapshot waveforms. Each point in time corresponds to the PSD vs. frequency of a snapshot. Snapshots last around 60 ms, and one is captured every second. The spectrogram shows PSD in dB above the minimum power of each snapshot. The red line indicates the electron plasma frequency. The Type II radio burst extends above fpe from the shock ramp towards the upstream region, covering the whole interval shown. (b) RPW-TDS/MAMP data product containing the maximum data point within a 7.8 ms interval of the absolute value of the electric field. (c)–(e) SBM1 snapshots containing Langmuir waves and electrostatic solitary waves, indicated by the red vertical lines in panel (b). (f)–(h) Frequency spectrogram of the SBM1 snapshots in panels (c)–(e). The black line indicates the electron plasma frequency. (i)–(k) PSD of the SBM1 snapshots in panels (c)–(e).
Current usage metrics show cumulative count of Article Views (full-text article views including HTML views, PDF and ePub downloads, according to the available data) and Abstracts Views on Vision4Press platform.
Data correspond to usage on the plateform after 2015. The current usage metrics is available 48-96 hours after online publication and is updated daily on week days.
Initial download of the metrics may take a while.