Fig. 4.
Download original image
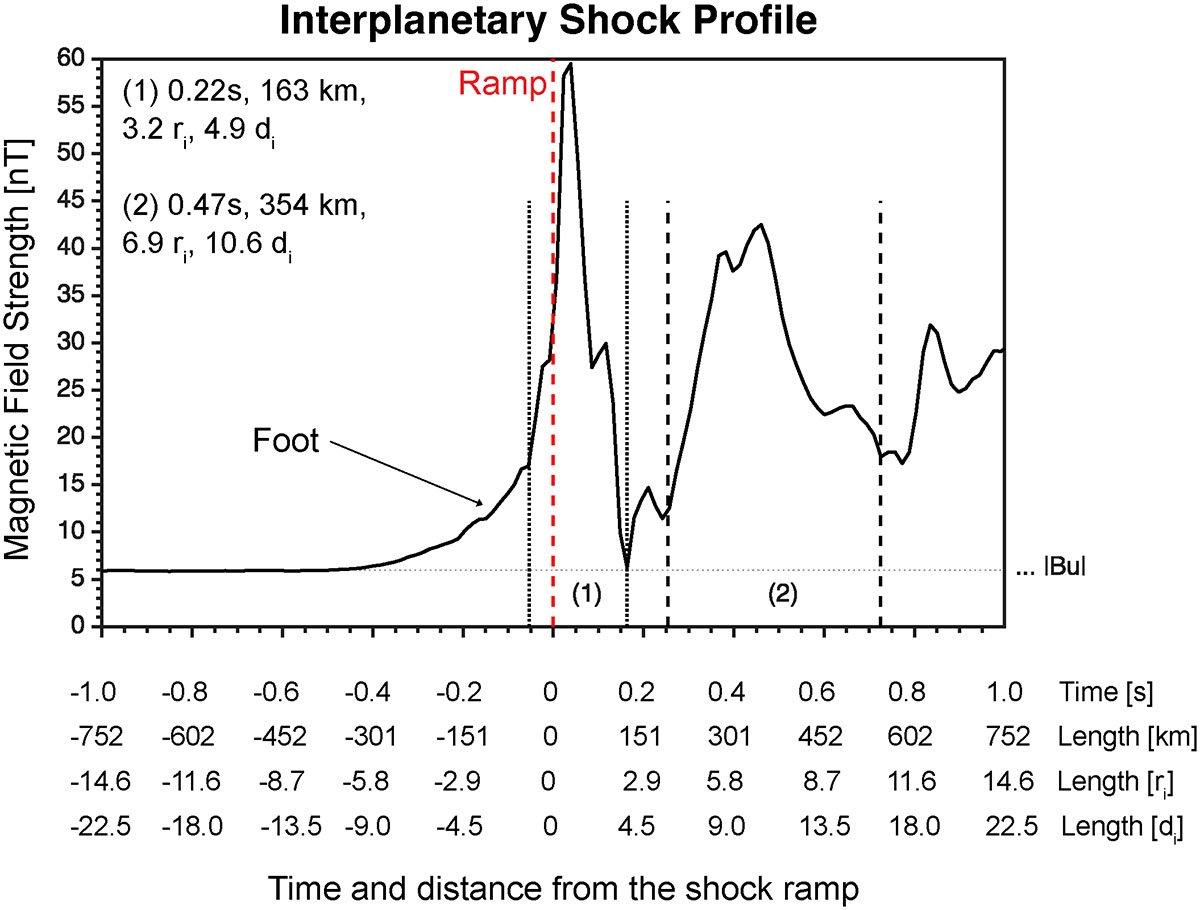
Magnetic field strength of the shock profile. Different x-axes are shown for different quantities (from top to bottom): time in seconds from the ramp, distance in km from the ramp, distance in ion gyro-radii from the ramp, and distance in ion inertial lengths from the ramp. The vertical red line shows the position where we have defined the shock ramp and the horizontal dashed line marks the upstream magnetic field strength. Two different regions are labelled by the vertical dashed lines, and their scales are quoted in the top left corner.
Current usage metrics show cumulative count of Article Views (full-text article views including HTML views, PDF and ePub downloads, according to the available data) and Abstracts Views on Vision4Press platform.
Data correspond to usage on the plateform after 2015. The current usage metrics is available 48-96 hours after online publication and is updated daily on week days.
Initial download of the metrics may take a while.