Fig. 2.
Download original image
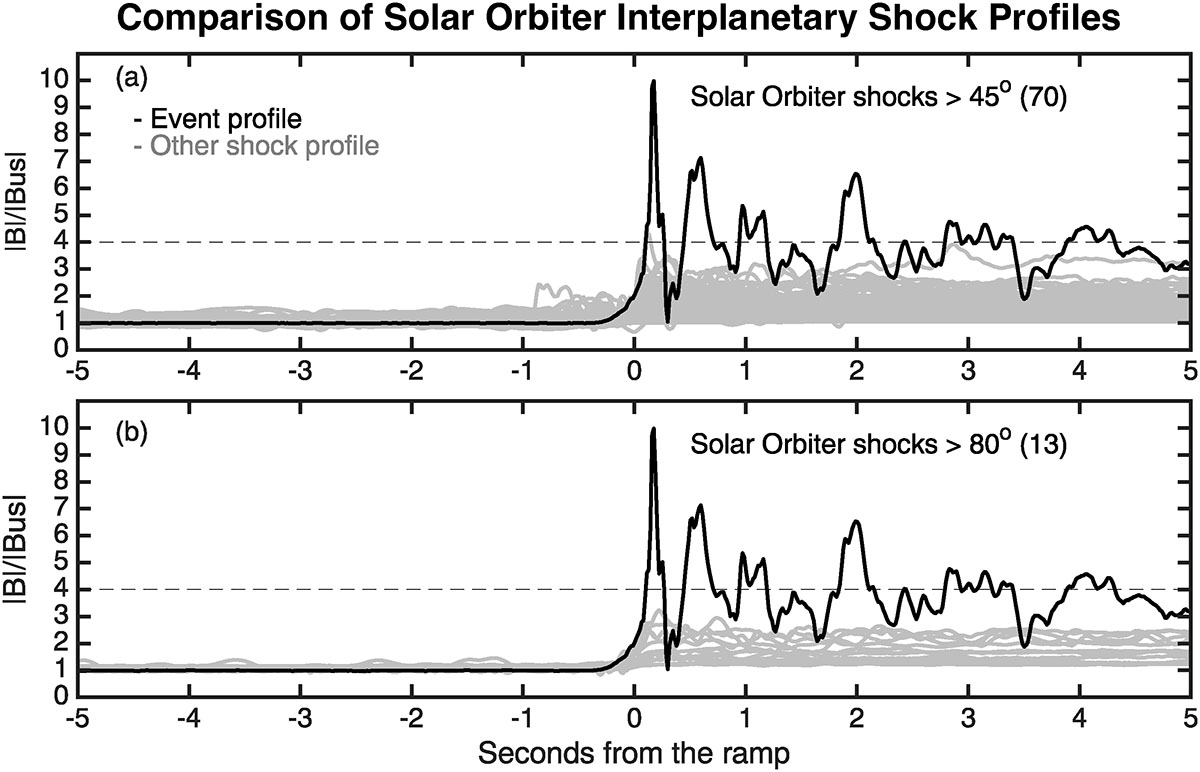
Comparison of Solar Orbiter shock profiles. This figure compares the high Mach number shock profile with other interplanetary shocks captured by Solar Orbiter. For both panels the high Mach number shock profile is indicated by the black curve, whereas the other shock profiles are in grey. The quantity plotted is the magnetic field strength normalised by the upstream value. Panel (a) includes shocks when θbn > 45°, whereas panel (b) only shows θbn > 80°. The horizontal dashed line in both panels indicates four, which is the maximum compression across the shock front according to the Rankine–Hugoniot relations.
Current usage metrics show cumulative count of Article Views (full-text article views including HTML views, PDF and ePub downloads, according to the available data) and Abstracts Views on Vision4Press platform.
Data correspond to usage on the plateform after 2015. The current usage metrics is available 48-96 hours after online publication and is updated daily on week days.
Initial download of the metrics may take a while.