Fig. A.1.
Download original image
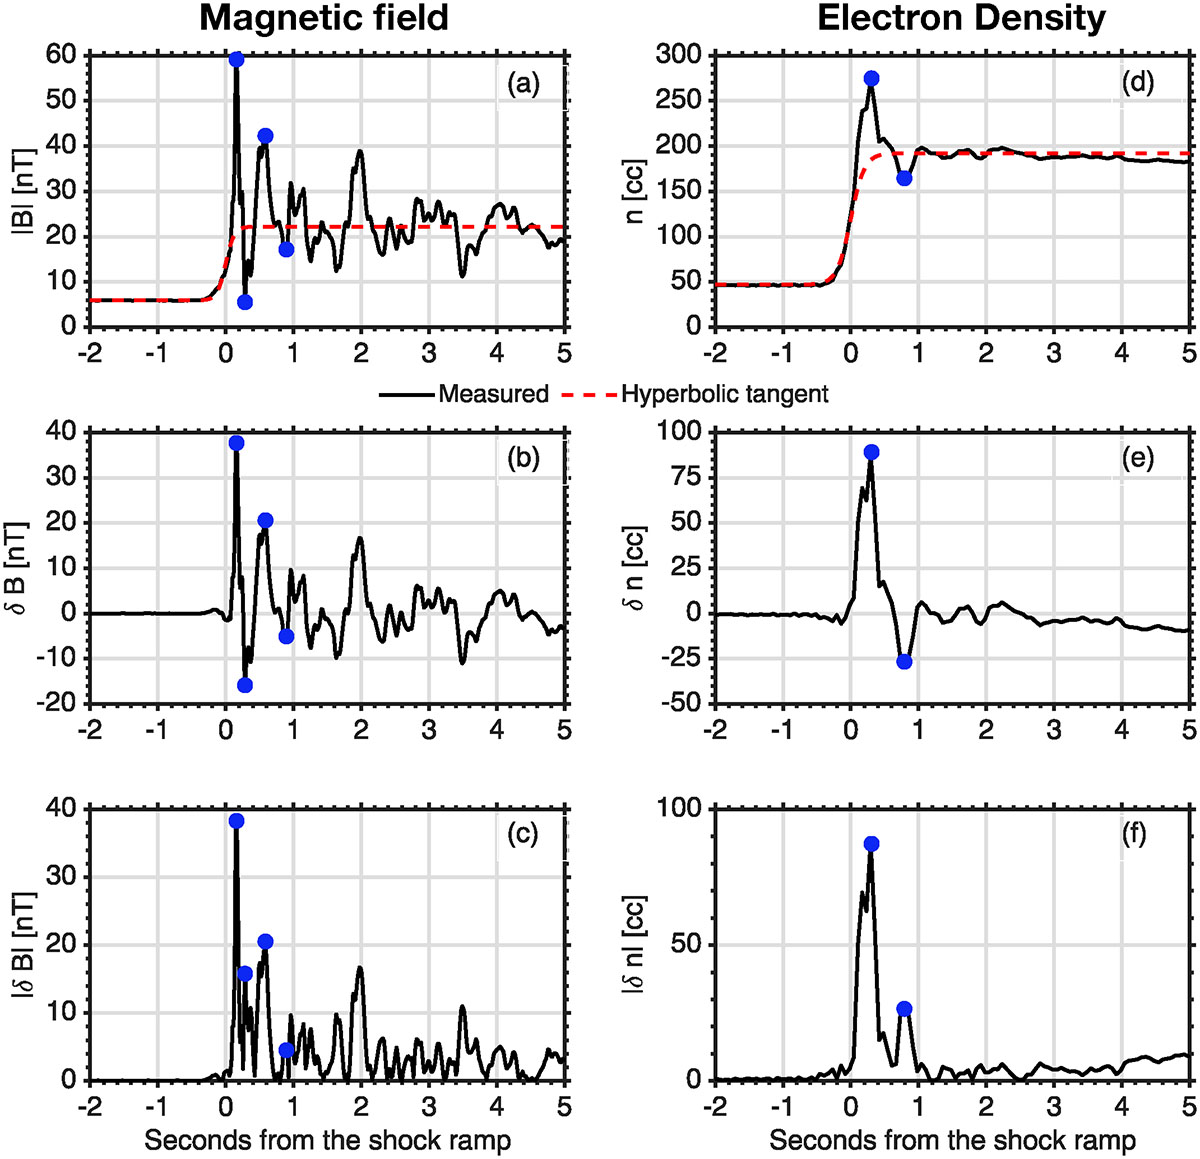
Features of the shock overshoot. Plotted in panel (a) is the shock magnetic field strength and a hyperbolic tangent (red dashed line). Panel (b) shows the magnetic field strength when the hyperbolic tangent is subtracted, whereas panel (c) is the absolute value of panel (b). The right hand column (d, e, f) is the same as the left column except it is performed for the electron density.
Current usage metrics show cumulative count of Article Views (full-text article views including HTML views, PDF and ePub downloads, according to the available data) and Abstracts Views on Vision4Press platform.
Data correspond to usage on the plateform after 2015. The current usage metrics is available 48-96 hours after online publication and is updated daily on week days.
Initial download of the metrics may take a while.