


| Issue |
A&A
Volume 709, May 2026
|
|
|---|---|---|
| Article Number | A217 | |
| Number of page(s) | 11 | |
| Section | Atomic, molecular, and nuclear data | |
| DOI | https://doi.org/10.1051/0004-6361/202558498 | |
| Published online | 19 May 2026 | |
Dissociative ionization cross-sections and the rate coefficients of H2S, OCS, LiH, and SiC
1
Department of Physics, School of Advanced Sciences, Vellore Institute of Technology, Vellore
632014,
Tamil Nadu,
India
2
School of Physical Sciences, The Open University,
Milton Keynes
MK7 6AA,
UK
★★ Corresponding author: This email address is being protected from spambots. You need JavaScript enabled to view it.
Received:
10
December
2025
Accepted:
20
February
2026
Abstract
Context. Electron-molecule and positron-molecule interactions play a major role in the interstellar medium. Although several inelastic channels have been studied in the literature, dissociative ionization studies of molecules are scarce.
Aims. To calculate the dissociative ionization cross-sections of cations emerging from H2S, OCS, LiH, and SiC, we present the theoretical dissociative ionization cross-sections for the first time.
Methods. We computed electron and positron impact ionization cross-sections using a semi-empirical binary encounter Bethe (BEB) method and we computed the partial ionization cross-sections (PICS) of cations using the mass spectrum dependence method coupled with BEB. We used the Relative and Absolute Partial Ionization and Dissociation cross-section code to calculate the dissociation energies.
Results. We present our findings on the dissociation energies of cations, along with the electron impact the PICS of cations, the total electron-impact and direct positron-impact ionization cross-sections of neutral molecules (TICS and DICS), and the ionization rate coefficients of cations.
Conclusions. The PICS calculations show a plausible agreement with the measured data for cations. In the case of dications, the present model fails to reproduce the experimental cross-sections. This study is the first to present Maxwellian rates for partial cross-sections.
Key words: astrochemistry / atomic processes / molecular data / molecular processes / radiative transfer / scattering
These authors equally contributed to this work.
© The Authors 2026
 Open Access article, published by EDP Sciences, under the terms of the Creative Commons Attribution License (https://creativecommons.org/licenses/by/4.0), which permits unrestricted use, distribution, and reproduction in any medium, provided the original work is properly cited.
This article is published in open access under the Subscribe to Open model. This email address is being protected from spambots. You need JavaScript enabled to view it. to support open access publication.
1 Introduction
Ionization represents one of the most fundamental and significant channels among inelastic processes occurring above the threshold of a target. Both ionization and dissociation serve as effective means of investigating the structural and dynamical properties of a system, as well as to identify the major fragment species produced (Marinković et al. 2025). Given their broad relevance, the need for accurate and reliable ionization cross-section data continues to rise. The catalog of molecules relevant to astrophysics is extensive and continues to expand. Investigations of electron-molecule collision dynamics and associated cross-sections provide a fundamental framework for understanding the intrinsic properties of these targets. Electrons play a fundamental role in astrophysics and investigating their interactions with molecules enhances our understanding of the chemical evolution of the Universe, as well as the conditions necessary for the formation of planetary systems and life (Schippers et al. 2019). Likewise, positron interactions with molecules influence the chemical makeup of these environments. In astrophysics, studying positron scattering is vital for explaining annihilation events taking place in the various regions of the Milky Way (Siegert 2023). In this work, we calculate the electron impact partial ionization cross-sections (PICS) of various cations arising from triatomic molecules, such as hydrogen sulfide (H2S), and carbonyl sulfide (OCS), as well as diatomic molecules, such as lithium hydride (LiH), and silicon carbide (SiC). The electron impact total ionization cross-sections (TICS), while the positron impact direct ionization cross-sections (DICS) are presented for all of the targets.
Interest in sulphur (S) atom-bearing molecules has been rising since the early 1970s, from the detection of carbon monosulphide (CS) in the interstellar medium (ISM) by Penzias et al. (1971). During the same period, other S-containing molecules such as carbonyl sulphide (OCS) were discovered by Jefferts et al. (1971) and hydrogen sulphide (H2S) was observed for the first time by Thaddeus et al. (1972). Subsequently, Heikkilä et al. (1999) detected the H2S molecule from an extragalactic source, while SiC was discovered by Cernicharo et al. (1989). Except for LiH, all the above molecules have been present in the 2018 and 2021 Census of Interstellar, Circumstellar, Extragalactic, Protoplanetary Disk, and Exoplanetary Molecules (McGuire 2018, 2022).
For H2S, Dragoljub S & Milan V (1985) measured the absolute total ionization cross-sections and electron attachment cross-sections from 10 to 100 eV using a parallel plate interaction chamber. Rao & Srivastava (1993) measured positive and negative absolute ionization and attachment cross-sections in the energy range of 0.001–1 keV, their work also includes measuring the appearance potentials also known as appearance energies (AE) for cations and doubly charged cations. Later Kim et al. (1997) calculated the TICS of H2S using the binary encounter Bethe (BEB) model developed by Kim & Rudd (1994). Lindsay et al. (2003) measured the cross-sections from threshold up to 1 keV for H2S, presented the absolute cross-sections of H+ and the combined cross-sections for H2S+ + HS+ + S+ with an uncertainty of ±7% and ±6% using a time-of-flight mass spectrometer with a position-sensitive detector (PSD). Vinodkumar et al. (2011) presented the TICS calculated using Improved Complex Scattering Potential-ionization contribution (ICSP-ic). Recently, Mahla & Antony (2025) calculated the total and partial photoionization cross-sections of H2S and OCS using R-matrix method. Apart from the cited application of TICS, the electron impact PICS have not been calculated in the literature using semi-empirical methods.
From the detection of OCS in the ISM to till date, there are a plethora of investigations that have been performed on OCS molecule and its radicals. Masuoka & Doi (1993) presented the OCS photoionization cross-sections that were measured using the time-of-flight mass spectrometry and a photoion-photoion coincidence method together with synchrotron radiation in the 20–100 eV energy range for singly OCS+, doubly OCS2+, and triply charged OCS3+. Hudson et al. (2003) measured the electron impact ionization cross-sections of OCS from ionization threshold to 250 eV and has also performed BEB calculations. The dissociation of singly to triply ionized carbonyl sulfide has been studied through electron impact ionization at an electron energy of 200 eV by Wang & Vidal (2003). Their OCS+ cross-sections display a good agreement with the BEB model of Kim & Rudd (1994). The recent work by Lomas et al. (2024) involved the use of a velocity map imaging study into the electron impact dissociative ionization dynamics of OCS. They also verified their experimental measurements by performing an equation-of-motion coupled cluster (EOM-CC) and complete active space self consistent field (CASSCF) potential energy surface calculations (PES) for OCS+ cation and OCS2+. They presented the time-of-flight mass spectrum and relative intensity of several cations, C+, O+, OC+, S+, CS+, OCS+, and OCS2+, dication measured at the incident electron energy of 100 eV. They also measured the dissociative ionization cross-sections for the seven cations mentioned above from 40 to 100 eV limit. The ionization cross-sections calculated using the BEB model were also recorded in the Astrochemistry Low-energy electron cross-section Database (ALeCS) by Gaches et al. (2024). The ionization cross-sections presented were calculated using various quantum chemistry theory such as Hartree-Fock (HF), second-order Møller–Plesset perturbation theory (MP2), screening corrected additivity rule (SCAR), and coupled cluster with single, double, and triple excitations (CCSDT). However the positron interaction cross-sections were not included in the database.
Silicon is a key component of interstellar dust and despite its low volatility, gas-phase organic molecules containing silicon are relatively common in certain interstellar and circumstellar environments. In the expanding shell around the evolved carbon star IRC+10216 (MacKay & Charnley 1999), eight such molecules have been detected so far, including four silicon carbides. Many more silicon carbides and other silicon-based molecules likely exist in this and similar sources (McCarthy et al. 2000). With laboratory spectra available in the future, a number of these could be identified using large radio telescopes. Some of the most intriguing candidates are cyclic silicon molecules, whose detection in space requires precise laboratory frequency measurements because ring structures typically lack the harmonically related rotational transitions seen in molecular chains. The linear silicon carbides, SiCn, where n = 3, 5–8 (McCarthy et al. 2000), are particularly promising for detection in IRC+10216 because theoretical calculations indicate they are highly polar and should have favorable rotational partition functions (Cernicharo et al. 1989). Since SiC is highly refractory and only condenses from vapor at high temperatures, it was traditionally assumed that if they are present in space, it would be located close to a star’s surface and have a small angular extent. However, observations revealed SiC at a substantial distance from the central star in IRC+10216, in a region where temperatures are relatively low (McCarthy et al. 2003). This observation underscores the necessity of investigating the ionization cross-section of SiC, as gaining insight into how it interacts with energetic particles in these cooler, outer regions and how it influences the circumstellar environment. Naghma & Antony (2013) calculated the ionization cross-section of silicon carbides using the complex scattering potential-ionization contribution (CSP-ic) method. Despite the significance of SiC in various astrophysical and material science contexts, studies on its ionization cross-section remain scarce. Therefore, in this present study, we focus on demonstrating both the total and partial ionization cross-sections of SiC.
Several years after the Big Bang, the first atoms formed were light elements, including hydrogen (H), deuterium (D), helium (He), and lithium (Li). As the Universe expanded and cooled, radiation temperatures dropped, allowing charged ions from these elements to recombine with electrons and form neutral atoms (Maoli et al. 1994). These neutral atoms then engaged in radiative association reactions, leading to the creation of molecular species such as H2, HD, and lithium hydride (LiH; Dalgarno et al. 1996). LiH has drawn significant attention in cosmology due to its potential role in observations of the early Universe (Peebles 2020). According to the hot Big Bang model, the first stars formed in a primordial gas composed primarily of hydrogen isotopes, helium isotopes, and lithium. Before the first generation of stars emerged, LiH and its ionized form LiH+ were among the only molecular species available that could interact with cosmic background radiation photons because of their strong permanent dipole moments (Stancil et al. 1996; Bougleux & Galli 1997). Lithium hydride’s notably large permanent dipole moment enables strong rotational and vibrational transitions, making it particularly important in astrophysical studies. Moreover, LiH likely played a significant role in cooling primordial gases in the early Universe, an essential process that contributed to the formation of the first stars (Maoli et al. 1996). Studies on the electron scattering of LiH are very limited and insufficient. For the first time, Shelat et al. (2011) provided the TICS for LiH calculated using the CSP-ic method. Recently, Umer et al. (2025) studied using the molecular convergent close-coupling method and calculated the TICS of LiH. We note that there is no literature available on the PICS of LiH.
Hence, the electron impact ionization cross-section for astrophysical molecules such as OCS, H2S, SiC, and LiH are important, as these molecules are scarcely discussed in cross-section studies in the literature. Here, we present the TICS, PICS and ionization rate coefficient for these molecules.
2 Methodology
The open-source Fortran program known as Relative and Absolute Partial Ionization and Dissociation cross-section (RAPIDCS) by Graves (2024) can be used to compute branching ratios, fragmentation pathways, and dissociation energies for singlecentered molecules. This program requires basic inputs, such as molecular geometry, a basis set, and the desired level of detail for the energy calculations. It utilizes either Molpro (Werner et al. 2012) or Psi4 (Smith et al. 2020) to carry out energy calculations. We chose to work with Psi4 in this work. Moreover, this program provides an easy and quick implementation of the energies and cross-sections, as discussed below.
2.1 Binary encounter Bethe model (BEB)
The BEB model is a simplified version of the binary-encounter-dipole (BED) model developed by (Kim & Rudd 1994) for electron impact total ionization cross-sections (TICS) for atoms, molecules, and ions. The BEB model provides a simple, easy-to-use formula for calculating total ionization cross-sections without needing to include any fitting parameters. This method calculates the TICS of each molecular orbital (i) and the sum of each molecular orbital gives the TICS of the molecule,
![Mathematical equation: $\[\sigma(E)=\sum_i^N \sigma_i^{\mathrm{BEB}}(E).\]$](/articles/aa/full_html/2026/05/aa58498-25/aa58498-25-eq1.png) (1)
(1)
The BEB formula to determine TICS is
![Mathematical equation: $\[\begin{aligned}\sigma_i^{\mathrm{BEB}}(E)= & \frac{4 \pi a_0^2 N_i}{\left(B_i / R\right)^2\left(t_i+\left(u_i+1\right) / m_i\right)} \\& \times\left[\frac{\ln~ t_i}{2}\left(1-\frac{1}{t_i^2}\right)+1-\frac{1}{t_i}-\frac{\ln~ t_i}{t_i+1}\right],\end{aligned}\]$](/articles/aa/full_html/2026/05/aa58498-25/aa58498-25-eq2.png) (2)
(2)
where ![Mathematical equation: $\[t_{i}=\frac{E}{B_{i}}, u_{i}=\frac{U_{i}}{B_{i}}\]$](/articles/aa/full_html/2026/05/aa58498-25/aa58498-25-eq3.png) , the incident electron energy (E), and the Bohr radius (a0 = 0.53 Å), the Rydberg constant is (R = 13.61 eV), mi is the scaling factor, Ni is the number of electrons in i-th molecular orbital, and Ui, Bi represent the orbital kinetic and binding energies of the orbital, i.
, the incident electron energy (E), and the Bohr radius (a0 = 0.53 Å), the Rydberg constant is (R = 13.61 eV), mi is the scaling factor, Ni is the number of electrons in i-th molecular orbital, and Ui, Bi represent the orbital kinetic and binding energies of the orbital, i.
The BEB models for positron impact have been derived from the original BEB model by Fedus & Karwasz (2019) and Franz et al. (2021). There have been four positron-BEB models developed to date: BEB-0, BEB-W, BEB-A, and BEB-B. The difference between BEB and the positron versions is that the exchange term in BEB is neglected for the positron impact. At energies near the ionization threshold, positron impact can lead to positronium (Ps) formation or annihilation, which is not considered in the BEB model. Hence, it is referred to as positron impact direct ionization cross-section (DICS). Fedus & Karwasz (2019) modified the original BEB model to develop BEB-0 for positron impact,
![Mathematical equation: $\[\begin{aligned}\sigma_i^{\mathrm{BEB}\text{-}0}(E)= & \frac{4 \pi a_0^2 N_i}{\left(B_i / R\right)^2\left(t_i+\left(u_i+1\right) / m_i\right)} \\& \times\left[\frac{\ln~ t_i}{2}\left(1-\frac{1}{t_i^2}\right)+1-\frac{1}{t_i}\right]^.\end{aligned}\]$](/articles/aa/full_html/2026/05/aa58498-25/aa58498-25-eq4.png) (3)
(3)
Here, we adopted the BEB-0 model to calculate the cross-sections for positron impact.
2.2 Dissociation energies and fragments selection process
For the diatomic molecule AB, the dissociation pathway and energy due to electron or positron impact ionization are shown below.
Fragmentation pathways:
![Mathematical equation: $\[\begin{aligned}e^{-/+}+\mathrm{AB} & \rightarrow \mathrm{AB}^{+}+e^{-}+e^{-/+}; \\& \rightarrow \mathrm{A}^{+}+\mathrm{B}+\mathrm{e}^{-}+\mathrm{e}^{-/+}; \\& \rightarrow \mathrm{A}+\mathrm{B}^{+}+e^{-}+e^{-/+}.\end{aligned}\]$](/articles/aa/full_html/2026/05/aa58498-25/aa58498-25-eq5.png) (4)
(4)
Dissociation energies for fragments,
![Mathematical equation: $\[\begin{aligned}& D_{A^{+}}=E\left(A^{+}\right)+E(B)-E\left(A B^{+}\right)+I P, \\& D_{B^{+}}=E(A)+E\left(B^{+}\right)-E\left(A B^{+}\right)+I P.\end{aligned}\]$](/articles/aa/full_html/2026/05/aa58498-25/aa58498-25-eq6.png)
The charged fragments A+ and B+ are generated with the associated dissociation energies DA+ and DB+, total energy of the fragments E(X), and the ionization energy (IP) of the parent molecule AB. The dissociation energies were calculated using CCSD with an augmented correlation-consistent polarized Valence Double-Zeta (aug-cc-pVDZ) basis set, using RAPIDCS (Graves 2024) and Psi4 (Smith et al. 2020). For the triatomic molecules, the selected fragmentation pathways are discussed (with examples) in Section 3.
2.3 Branching ratios
Once the dissociation energy (Dj) of a fragment is known, the branching ratio can be determined. We present Huber et al. (2019)’s method to find the branching ratios. The unnormalized probability (bj) of formation of the fragment (j) can be determined using dissociation energies, following the method proposed by Huber et al. (2019), expressed as
![Mathematical equation: $\[b_j=\left(\frac{1}{D_j}\right)^\alpha.\]$](/articles/aa/full_html/2026/05/aa58498-25/aa58498-25-eq7.png) (5)
(5)
Here, bj is the un-normalized probability of a fragment, i, and α is set to 3 for the electron scattering, determined by Huber et al. (2019). We note that α is not energy-dependent.
To normalize the probability, the condition is given by
![Mathematical equation: $\[\Gamma_j(E)=\left\{\begin{array}{ll}0 & \text { if } E<D_j \\\frac{b_j}{\sum_j^k b_j} & \text { if } E \geq D_j\end{array}.\right.\]$](/articles/aa/full_html/2026/05/aa58498-25/aa58498-25-eq8.png) (6)
(6)
Here, Γj(E) is the branching ratio of the fragment, E is the impact electron or positron energy, and k is the total number of fragments. If the electron/positron impact mass spectrum is available, we can calculate the branching ratio of fragment as the ratio of the relative intensity of the fragment j, Rj(E), to that of the total ion intensity T(E), as Γj(E) = Rj(E)/T(E). In principle, this is same as Eq. (6). At E ≥ Dj, the value of Γj(E) depends on the impact energy. We can validate that Γj(E) represents the asymptotic branching ratios, which is when E goes to infinity via
![Mathematical equation: $\[\Gamma_j^{M S D}(E)= \begin{cases}0 & \text { if } E<D_j \\ \Gamma_j(E)\left[1-\left(\frac{D_j}{E}\right)^\nu\right] & \text { if } E \geq D_j.\end{cases}\]$](/articles/aa/full_html/2026/05/aa58498-25/aa58498-25-eq9.png) (7)
(7)
Here, MSD refers to the mass spectrum-dependent branching ratio. The dependence of the branching ratio on the incident electron energy arises from the dissociation energies associated with individual dissociation channels. When the incident electron energy is below the dissociation energy of a given cationic fragment, no dissociation occurs. Once the incident energy equals or exceeds the dissociation energy (Dj), dissociative ionization becomes likely, and the channel opens. Since the mass spectrum is measured as a function of incident electron energy, different dissociation channels open at different energies. Consequently, the branching ratio is not constant, but varies with the incident electron energy and computing Eq. (7) makes this possible. The value of ν, determined by Janev & Reiter (2004), is 1.5 ± 0.25, ν = 1.5, which is the value adopted in this work. In addition, the summation of Γj(E) should be unity and must follow the condition Γj(E) = σj(E)/σ(E), where σj(E) is the partial ionization cross-section of the cation. Huber et al. (2019) introduced this approach and Graves et al. (2022) incorporated the approach into RAPID-CS (Graves 2024).
2.4 PICS
To calculate the PICS the branching ratio (![Mathematical equation: $\[\Gamma_{j}^{M S D}\]$](/articles/aa/full_html/2026/05/aa58498-25/aa58498-25-eq10.png) ) is multiplied by the total ionization cross-section of the parent molecule,
) is multiplied by the total ionization cross-section of the parent molecule,
![Mathematical equation: $\[\sigma_j^{P I C S}(E)=\Gamma_j^{M S D}(E) \times \sigma(E).\]$](/articles/aa/full_html/2026/05/aa58498-25/aa58498-25-eq11.png) (8)
(8)
2.5 Thermal rate coefficients
The thermal rates are calculated using the Maxwell-Boltzmann (MB) distribution function,
![Mathematical equation: $\[k_i\left(T_e\right)=\sqrt{\frac{8}{\pi m_e\left(k_B T_e\right)^3}} \int_0^{\infty} \sigma(E) \exp \left(-\frac{E}{k_B T_e}\right) E \mathrm{~d} E.\]$](/articles/aa/full_html/2026/05/aa58498-25/aa58498-25-eq12.png) (9)
(9)
In the above equation, kB is the Boltzmann constant, me is the mass of the electron, Te is the electron temperature, σ(E) is the total or partial ionization cross-section in 10−16 cm2, and E is the incident kinetic energy. The modified Arrhenius equation is expressed as
![Mathematical equation: $\[k_i(T_e)=A T_e^n \times \exp \left(-E_{a c t} / T_e\right),\]$](/articles/aa/full_html/2026/05/aa58498-25/aa58498-25-eq13.png) (10)
(10)
where the ![Mathematical equation: $\[A T_{e}^{n}\]$](/articles/aa/full_html/2026/05/aa58498-25/aa58498-25-eq14.png) the pre-factor is dependent on temperature in cm3 s−1, while the activation energy (Eact) is also represented in eV. The extrapolation parameters are: A (cm3s−1 eV−n), n, and Eact from the rate coefficients.
the pre-factor is dependent on temperature in cm3 s−1, while the activation energy (Eact) is also represented in eV. The extrapolation parameters are: A (cm3s−1 eV−n), n, and Eact from the rate coefficients.
3 Results
All the molecular structures were optimized using DFT/aug-cc-pVTZ (aVTZ), while the orbital binding energies (Bi) and orbital kinetic energies (Ui) were calculated using the Hartree-Fock (HF)/aVTZ. The HF approximation is considered here as the BEB TICS calculated with orbital parameters obtained from the HF approximation is found to give reasonable agreement with the experimental TICS measurements within the experimental uncertainty of 10 ~ 15% (Karwasz et al. 2014). The BEB TICS obtained using post-HF methods such as DFT, where the electron correlations are addressed, tend to be higher than the experimental TICS (Gupta et al. 2017; Shanmugasundaram et al. 2024); hence, they are not considered in the present study. In the present work, we use the scaling factor (mi) in the BEB model, as shown in Eq. (2). In general, this term can be neglected if we are dealing with molecule consisting of atoms of Z ≤ 10. As the current molecular targets consists of Silicon (Z = 14) and Sulfur (Z = 16) atom, we chose to include this. In short, mi is the principal quantum number of the dominant atomic orbital (AO) of a molecular orbital (MO). To calculate mi, the association of each atomic orbital with each molecular orbital can be found by calculating the square of the linear combination of atomic orbital-to-molecular orbital (LCAO-MO) coefficients |Cμi|2 and checking the atomic orbital with the highest value. The squared coefficient shows the probability density of each basis function to the molecular orbital in the setting of LCAO theory. We get a first-order quantitative estimate of orbital characters; however, the drawback is that such an approach ignores multi-center contributions and is strongly correlated to the basis set. Kim et al. (1997); Ali & Kim (2008) employed this method in their works to calculate TICS for several diatomic, triatomic, and polyatomic molecules. As done by Ali & Kim (2008), we kept the scaling factor to be unity for 1s, 2s, and 2p atomic orbitals. However, for atomic orbitals where the principal quantum number is ≥3, the BEB model significantly underestimates the cross-sections at lower incident energies. To correct this inadequacy, mi ought to be introduced. Huo & Kim (2000) discussed the fact that systems with heavy atoms (i.e., an electron with n ≥ 3) has the majority of its charge distribution out of the core region. Whilst the penetration probability into the core is small, once it is inside, it travels with a very high velocity. On the contrary, ionization is favorable while the electron is outside the core region and moving more slowly. Scaling by 1/mi effectively lowers their impact from the core region. Moreover, the factor (ui + 1) must be removed in the limit of any unbound target electron to be consistent with the original Mott cross-section. Hence, the factor should gradually be reduced for loosely bound valence electrons. All the aforementioned calculations were performed using the PySCF library in Python (Sun et al. 2018, 2020). In the following subsections, we present the PICS, TICS, and DICS results, along with the rate coefficients.
Occupied molecular orbitals for H2S.
3.1 H2S: Hydrogen sulfide
The PICS were calculated using the BEB model as presented in Sect. 2.1 and the required input parameters are given in Table 1.
The possible fragmentation pathways for H2S are:
![Mathematical equation: $\[\mathrm{H}_2 \mathrm{S}+e^{-} \rightarrow \mathrm{H}_2 \mathrm{S}^{+}+2 e^{-};\]$](/articles/aa/full_html/2026/05/aa58498-25/aa58498-25-eq15.png) (R1)
(R1)
![Mathematical equation: $\[\rightarrow \mathrm{H}^{+}+\mathrm{HS}+2 e^{-};\]$](/articles/aa/full_html/2026/05/aa58498-25/aa58498-25-eq16.png) (R2)
(R2)
![Mathematical equation: $\[\rightarrow \mathrm{H}_2^{+}+\mathrm{S}+2 e^{-};\]$](/articles/aa/full_html/2026/05/aa58498-25/aa58498-25-eq17.png) (R2)
(R2)
![Mathematical equation: $\[\rightarrow \mathrm{S}^{+}+\mathrm{H}_2+2 e^{-};\]$](/articles/aa/full_html/2026/05/aa58498-25/aa58498-25-eq18.png) (R3)
(R3)
![Mathematical equation: $\[\rightarrow \mathrm{HS}^{+}+\mathrm{H}+2 e^{-};\]$](/articles/aa/full_html/2026/05/aa58498-25/aa58498-25-eq19.png) (R4)
(R4)
![Mathematical equation: $\[\rightarrow \mathrm{H}_2 \mathrm{S}^{2+}+3 e^{-};\]$](/articles/aa/full_html/2026/05/aa58498-25/aa58498-25-eq20.png) (R5)
(R5)
![Mathematical equation: $\[\rightarrow \mathrm{S}^{2+}+\mathrm{H}_2+3 e^{-}.\]$](/articles/aa/full_html/2026/05/aa58498-25/aa58498-25-eq21.png) (R6)
(R6)
The measured appearance potentials of Rao & Srivastava (1993) were used to calculate the branching ratio of each cation using Huber’s method, as discussed in Sect. 2.3. This was due to the absence of an absolute electron impact mass spectrum of H2S. The appearance energy corresponding to each pathway and the calculated dissociation energy are presented in Table 2. We compared our calculated cross-sections with the literature data of Rao & Srivastava (1993) and Lindsay et al. (2003) in Fig. 1. The overall agreement of the present calculation with Rao & Srivastava (1993) is good for cations S+, HS+, H2S+ and our combined cross-sections of S+ + HS+ + H2S+ are a good match to the Lindsay et al. (2003) measurements. The uncertainties of Rao & Srivastava (1993) are ±13% and Lindsay et al. (2003) are approximately ±7.5%. The maximum cross-section of H+ is 0.744 × 10⁻¹⁶ cm2 at 54 eV from our calculations and it was measured to be 0.173 × 10⁻¹⁶ cm2 at 75 eV by Rao & Srivastava (1993), followed by 0.628 × 10⁻¹⁶ cm2 at 80 eV in the work of Lindsay et al. (2003). Similarly for the combined cross-sections S+ + HS+ + H2S+ the maxima was found to be 4.7728 × 10⁻¹⁶ cm2 at 48 eV from our calculations, whereas the data of Rao & Srivastava (1993); Lindsay et al. (2003) give 3.71 × 10⁻¹⁶ cm2 at 70 eV and 5.03 × 10⁻¹⁶ cm2 at 40 eV. The calculated partial ionization cross-sections for the cations S+, HS+, and H2S+ show maxima of 1.321 × 10⁻¹⁶ cm2, 1.060 × 10⁻¹⁶ cm2, and 2.396 × 10⁻¹⁶ cm2 at incident electron energies of 50 eV, 51 eV, and 46 eV, respectively. On the contrary, the measured data of Rao & Srivastava (1993) peaks at smaller cross-section values (0.895 × 10⁻¹⁶ cm2, 0.834 × 10⁻¹⁶ cm2, and 1.996 × 10⁻¹⁶ cm2) and at considerably higher incident energies of 75,80, and 70 eV, as observed from Figure 1. The huge disagreement observed in the lighter ions could be due to errors in the experimental measurements, as the lighter ions travel relatively at a higher speed than the larger ions Douglas et al. (2005). For the dications, the BEB model and Huber’s method are not able to account for the Auger-Meitner process or Coulomb explosion; hence, the large discrepancy.
It can be seen that the pathways R2, R5, and R6 have the highest appearance thresholds and the smallest branching ratios from Table 2. The branching ratios are computed using Eq. (6), which shows an inverse relationship with the dissociation threshold. As a result, we expect the fragments with higher dissociation energies to have lower branching ratios.
The TICS results are presented in Fig. 2, calculated using the Bi and Ui values shown in Table 1. The present TICS maxima is 6.05 × 10⁻¹⁶ cm2 at 51 eV shown in solid blue line. The peak of our TICS calculation is higher than the literature, as the scaling factor, mi, was set to 3. This was because the 2b orbitals (2b1 + 2b2) and 4a1, 5a1 orbitals had principal quantum numbers of dominant AO of 3, as shown in Table 1.
The calculated TICS shows a good match with the measurements of Dragoljub S & Milan V (1985) and also contained within the uncertainties reported by Lindsay et al. (2003). Our cross-sections were higher than the Rao & Srivastava (1993) measurements and calculations of Kim et al. (1997) and Vinodkumar et al. (2011). Kim et al. (1997) also used the scaling factor mi = 3 only on the (2b2) orbital and their Bi and Ui values were 10.48 eV (experimental IP) and 45.68 eV and their dominant AO of 2b2 MO is S 3p. The dashed gray line in Fig. 2 represents the cross-section where the scaling is mi = 3 for only the 2b2 orbital, as shown by Kim et al. (1997); this result is also within the uncertainties of Lindsay et al. (2003). We believe that the huge discrepancies between our present TICS with the calculations in literature data are due to the values of orbital binding and kinetic energies calculated using aVTZ plus the inclusion of the scaling factor (mi). In Fig. 3, rate coefficients are presented for all fragments calculated using the corresponding cross-sections shown in Figs. 1 and 2. For the H2S parent molecule’s TICS, the calculated rate coefficients were fitted with modified Arrhenius equation, the fitting parameters A, n, and Eact are 5.58 × 10⁻⁸ cm3 s−1 eV−n, 0.48, and 11.04 eV.
Partial cross-sections and Arrhenius parameters of H2S.
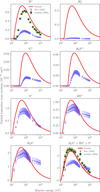 |
Fig. 1 PICS of cations dissociating from H2S: present data (solid red line) compared with the measurements from (Rao & Srivastava 1993, lilac upright triangles) and Lindsay et al. (2003, green squares). |
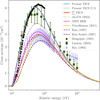 |
Fig. 2 TICS of H2S: present TICS (Solid blue line), Present TICS where the kinetic energy of the HOMO / 3 (dashed grey line), Summation of all calculated PICS (dashed coral colored line), Recommended data from the ALeCS database from Gaches et al. (2024) (dashed-dotted green line); Linstrom & Mallard (2001) NIST BEB data (solid pink line); Vinodkumar et al. (2011) BEB data (Solid orange line); Kim et al. (1997) BEB data and Kim et al. (1997) BEB data scaled with the kinetic energy of the HOMO / 3 (dashed brown line); Dragoljub S & Milan V (1985) measurements (black diamond); Lindsay et al. (2003) measurements (green squares); and Rao & Srivastava (1993) measurements (upright lilac triangles). |
3.2 OCS: Carbonyl sulphide
The values of Bi and Ui are shown in Table 3. The literature value of ionization potential is 11.180 ± 0.010 eV. We used these values to calculate the TICS using the BEB model. For a linear triatomic molecule OCS, with the structure of O=C=S, the possible fragmentation pathways are:
![Mathematical equation: $\[\mathrm{OCS}+e^{-} \rightarrow \mathrm{OCS}^{+}+2 e^{-};\]$](/articles/aa/full_html/2026/05/aa58498-25/aa58498-25-eq23.png) (A1)
(A1)
![Mathematical equation: $\[\rightarrow \mathrm{OC}^{+}+\mathrm{S}+2 e^{-};\]$](/articles/aa/full_html/2026/05/aa58498-25/aa58498-25-eq24.png) (A2)
(A2)
![Mathematical equation: $\[\rightarrow \mathrm{OC}+\mathrm{S}^{+}+2 e^{-};\]$](/articles/aa/full_html/2026/05/aa58498-25/aa58498-25-eq25.png) (A3)
(A3)
![Mathematical equation: $\[\rightarrow \mathrm{O}^{+}+\mathrm{CS}^{+}+2 e^{-};\]$](/articles/aa/full_html/2026/05/aa58498-25/aa58498-25-eq26.png) (A4)
(A4)
![Mathematical equation: $\[\rightarrow \mathrm{CS}+\mathrm{O}^{+}+2 e^{-};\]$](/articles/aa/full_html/2026/05/aa58498-25/aa58498-25-eq27.png) (A5)
(A5)
![Mathematical equation: $\[\rightarrow \mathrm{SO}^{+}+\mathrm{C}+2 e^{-};\]$](/articles/aa/full_html/2026/05/aa58498-25/aa58498-25-eq28.png) (A6)
(A6)
![Mathematical equation: $\[\rightarrow \mathrm{SO}+\mathrm{C}^{+}+2 e^{-};\]$](/articles/aa/full_html/2026/05/aa58498-25/aa58498-25-eq29.png) (A7)
(A7)
![Mathematical equation: $\[\rightarrow \mathrm{O}^{+}+\mathrm{C}+\mathrm{S}+2 e^{-};\]$](/articles/aa/full_html/2026/05/aa58498-25/aa58498-25-eq30.png) (A8)
(A8)
![Mathematical equation: $\[\rightarrow \mathrm{O}+\mathrm{C}^{+}+\mathrm{S}+2 e^{-};\]$](/articles/aa/full_html/2026/05/aa58498-25/aa58498-25-eq31.png) (A9)
(A9)
![Mathematical equation: $\[\rightarrow \mathrm{O}+\mathrm{C}+\mathrm{S}^{+}+2 e^{-};\]$](/articles/aa/full_html/2026/05/aa58498-25/aa58498-25-eq32.png) (A10)
(A10)
![Mathematical equation: $\[\rightarrow \mathrm{OCS}^{2+}+3 e^{-}.\]$](/articles/aa/full_html/2026/05/aa58498-25/aa58498-25-eq33.png) (A11)
(A11)
The fragmentation pathway should be selected carefully. The double-ionization pathways and the pathways with new bond formation should be excluded when using Huber’s method. Pathways A6 and A7 are not allowed since they require the formation of a new bond: S = O. If two fragmentation pathways produce the same charged fragment, only the one with the lowest energy is considered. Also, if two fragments are identical, the two pathways would be equivalent. Consequently, one of these pathways is excluded by comparing the fragment energies to identify and eliminate duplicates.
In Table 4, we show the relative intensities for different cations dissociating from OCS taken from different sources at various incident energies. Lomas et al. (2024) measured the EIMS at 100 eV of incident electron energy, Wang & Vidal (2003) measured the EIMS at 200 eV and the data posted from NIST (Linstrom & Mallard 2001) assumed to be at 70 eV. We performed two individual PICS calculations:
The PICS calculated using the mass spectrum data from the work of Lomas et al. (2024) from appearance threshold to 5 keV;
The PICS calculated using the mass spectrum data from the work of Wang & Vidal (2003) at 200 eV.
For the cations O+, S+, OCS+, both calculations display an acceptable agreement, as shown in Fig. 4. In the case of C+, the Wang & Vidal (2003) data match our 200 eV calculation. For the other cations, the measurement of Wang and Vidal and our calculations do not show as good a match.
When we compare the PICS measurements of Lomas et al. (2024) with our PICS calculation (red line) in Fig. 4, we do see a plausible agreement with the measurements, with the exception of OCS+, which does not display a good agreement. The inadequacy is due to the absence of appearance potentials in the literature. We believe the appearance potentials must be slightly greater than our calculated dissociation energies. We could not verify this because the Lomas et al. (2024) partial cross-sections are measured from 40 to 100 eV. The maximum partial ionization cross-sections in the present work and those from Lomas et al. (2024), the measurements of each cations are as follows. For C+, the calculated PICS were found to be 0.4768 × 10⁻¹⁶ cm2 at 86 eV whereas the measured cross-sections were 0.5571 × 10⁻¹⁶ cm2 at 90 eV. In the case of O+: 0.3137 × 10⁻¹⁶ cm2 at 78 eV and the measured PICS were 0.3342 × 10⁻¹⁶ cm2 at 100 eV. For OC+: 0.7342 × 10⁻¹⁶ cm2 at 65 eV and the measured data was 0.8052 × 10⁻¹⁶ cm2 at 80 eV. For OCS2+: 0.3270 × 10⁻¹⁶ cm2 at 91 eV and the measured data was 0.4138 × 10⁻¹⁶ cm2 at 70 eV, S+ 2.7474 × 10⁻¹⁶ cm2 at 59 eV and the measured PICS is 2.9275 × 10⁻¹⁶ cm2 at 95 eV. For CS+: 0.3075 × 10⁻¹⁶ cm2 at 70 eV and measured PICS 0.3311 × 10⁻¹⁶ cm2 at 65 eV. For OCS+: 2.5299 × 10⁻¹⁶ cm2 at 51 eV and the measured PICS 2.2336 × 10⁻¹⁶ cm2 at 100 eV.
In Fig. 5, we present the total ionization cross-sections and a comparison with the literature. Our calculation yielded maximum TICS of 7.3349 × 10⁻¹⁶ cm2 at 63 eV, whereas the scaled BEB maximum cross-section is 5.4477 × 10⁻¹⁶ cm2 at 79 eV.
Measured Lomas et al. (2024) maximum cross-sections are 7.44 × 10⁻¹⁶ cm2 at 100 eV, while the Hudson et al. (2003) BEB calculations display a maximum cross-section of 4.9 × 10⁻¹⁶ cm2 at 160 eV. The ALeCS database contains the TICS results calculated using CCSD(T) orbital binding and orbital kinetic energies. Gaches et al. (2024) reported a maximum cross-section of 4.4680 × 10⁻¹⁶ cm2 at 94.73 eV. The Kim et al. (1997) calculation displays a maximum cross-section of 4.9863 × 10⁻¹⁶ cm2 at 83.51 eV. The data from Srivastava display a peak around 5.3 × 10⁻¹⁶ cm2 at 135 eV in the work cited by Kim et al. (1997) as private communication. The kinetic rate constants for the partial and total ionization cross-sections were fitted for using the modified Arrhenius equation to predict the rate coefficients up until 100 eV. The values of the fitting parameters for TICS rate coefficient are: A, n, and Eact as 4.37 × 10⁻⁸ cm3 s−1 eV−n, 0.622, and 12.56 eV. The rate coefficients are shown in Fig. 6.
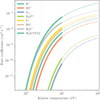 |
Fig. 3 Rate constants of the cations of H2S: solid curves show the rates calculated using the MB distribution. Dashed lines show the extrapolated data using the modified Arrhenius equation. |
Occupied molecular orbitals for OCS.
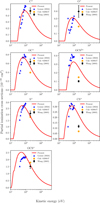 |
Fig. 4 PICS of cations dissociating from OCS: present calculation (solid red line), Lomas et al. (2024) measurements (blue upright triangles), our PICS calculation at 200 eV (yellow circles), and Wang & Vidal (2003) measurements at 200 eV (black diamonds). |
3.3 LiH: Lithium hydride
The LiH PICS for the cations shown in Fig. 7 were calculated using the parameters provided in Table 6. The selected fragmentation pathways used to find dissociation energies for the cations are:
![Mathematical equation: $\[\mathrm{LiH}+e^{-} \rightarrow \mathrm{LiH}^{+}+2 e^{-};\]$](/articles/aa/full_html/2026/05/aa58498-25/aa58498-25-eq34.png) (B1)
(B1)
![Mathematical equation: $\[\rightarrow \mathrm{H}^{+}+\mathrm{Li}+2 e^{-};\]$](/articles/aa/full_html/2026/05/aa58498-25/aa58498-25-eq35.png) (B2)
(B2)
![Mathematical equation: $\[\rightarrow \mathrm{Li}^{+}+\mathrm{H}+2 e^{-}.\]$](/articles/aa/full_html/2026/05/aa58498-25/aa58498-25-eq36.png) (B3)
(B3)
The PICS of the cations Li+ closely match with the LiH+ because both cations have similar dissociation energies. The maximum PICS are 0.2212 × 10⁻¹⁶ cm2 at 47 eV for H+, 2.3448 × 10⁻¹⁶ cm2 at 30 eV for Li+, and 2.3737 × 10⁻¹⁶ cm2 at 30 eV for LiH+. The comparison of the PICS for LiH is not available in the literature.
The TICS in Fig. 8 is calculated using the input parameters in Table 5. The maximum TICS observed for LiH is 4.906 × 10⁻¹⁶ cm2 at 31 eV. Umer et al. (2025) shows a reasonable agreement with the present TICS, as it was calculated using the molecular convergent close coupling (MCCC) method. Models A and B from Shelat et al. (2011) were calculated using the CSP-ic method by varying the ratios of total inelastic cross-section to the total ionization cross-section values. The present TICS shows a good match at low energies; however, it underestimates the Shelat et al. (2011) data at higher energies.
The kinetic rates were calculated for the PICS and TICS of LiH using the modified Arrhenius function. The fitting parameters A, n, and Eact are 7.36 × 10⁻⁸ cm3 s−1 eV−n, 0.30, 8.012 eV, for total rate coefficient of LiH and the rates are shown in Fig. 9.
Partial cross-sections and Arrhenius parameters for OCS.
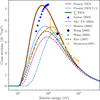 |
Fig. 5 TICS of OCS: present data (solid red line), summation of all calculated PICS (solid green line), Lomas et al. (2024) measurements (upright triangle), Gaches et al. (2024) CCSD(T) calculations (dashed purple line), Hudson et al. (2003) BEB data (dashed blue line), Wang & Vidal (2003) measurement and BEB data at 200 eV (black diamond and blue cross), Kim et al. (1997) BEB calculation (dashed black line), and the Kim et al. (1997) measurements (orange circles) based on the Srivastava data. |
Occupied molecular orbitals for LiH.
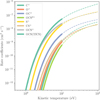 |
Fig. 6 Rate constants of the cations of OCS: solid curves show the rates calculated using the MB distribution. Dashed lines show the extrapolated data using the modified Arrhenius equation. |
3.4 SiC: Silicon carbide
Table 8 provides the necessary data, such as mass to charge ratio, dissociation energies, and the branching ratio used to calculate the PICS for SiC. Using these data, the calculated PICS are illustrated in Fig. 10. The fragmentation pathways for SiC are:
![Mathematical equation: $\[\mathrm{SiC}+e^{-} \rightarrow \mathrm{SiC}^{+}+2 e^{-};\]$](/articles/aa/full_html/2026/05/aa58498-25/aa58498-25-eq37.png) (C1)
(C1)
![Mathematical equation: $\[\rightarrow \mathrm{C}^{+}+\mathrm{Si}+2 e^{-};\]$](/articles/aa/full_html/2026/05/aa58498-25/aa58498-25-eq38.png) (C2)
(C2)
![Mathematical equation: $\[\rightarrow \mathrm{Si}^{+}+\mathrm{C}+2 e^{-}.\]$](/articles/aa/full_html/2026/05/aa58498-25/aa58498-25-eq39.png) (C3)
(C3)
These fragmentation pathways, as mentioned above, do not include dications. For these cations, there are no data presently available for comparison. The maximum cross-section observed for SiC+ is 4.5734 × 10⁻¹⁶ cm2 at 50 eV, C+ is 0.1093 × 10⁻¹⁶ cm2 at 100 eV, and Si+ is 0.0866 × 10⁻¹⁶ cm2 at 105 eV. The cation SiC+ exhibits a larger cross-section, compared to both Si+ and C+; this trend is observed to be in line with what is expected from Eq. (5). When the Dj value is low, the resulting cross-section is larger.
Figure 11 illustrates that the present TICS calculated with the input parameters in Table 7, using the BEB model, is compared with the CSP-ic data of Naghma & Antony (2013). The present TICS shows a maximum cross-section of SiC, 4.707 × 10⁻¹⁶ cm2 at 54 eV. The present data agree well at lower energies, but at higher energies, the CSP-ic results end up underestimated. Furthermore, there are no other published data available for comparison. The rate coefficients for the PICS and TICS of SiC are presented in Fig. 12. The fitted parameters for rate constants using a modified Arrhenius equation for the TICS of SiC; A, n, Eact are 4.462 × 10⁻⁸ cm3 s−1 eV−n, 0.475, and 11.202 eV.
Partial ionization cross-sections and Arrhenius parameters for LiH.
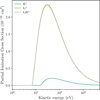 |
Fig. 7 PICS of cations dissociating from LiH: present calculations of LiH+ (solid gray line), Li+ (solid light green line), and H+ (solid dark green line). |
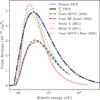 |
Fig. 8 LiH TICS: the present BEB calculation (solid purple line); summation of the PICS (dashed black line); Umer et al. (2025) MCCC (dashed green line); Umer et al. (2025) BE-scaled cross-section (dashed magenta line); Shelat et al. (2011) csp-ic model A (dashed yellow line); Shelat et al. (2011); csp-ic model B (dashed pink line); Umer et al. (2025) MCCC Born-corrected (dashed light blue line). |
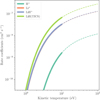 |
Fig. 9 Rate constants of the cations of LiH: solid curves show the rates calculated using the MB distribution. Dashed lines show the extrapolated data using the modified Arrhenius equation. |
3.5 DICS
We present the direct positron impact ionization cross-sections of the molecules in Fig. 13. The maximum cross-sections for H2S, OCS, LiH, and SiC are 4.9281 × 10⁻¹⁶ cm2 at 59 eV, 5.9414 × 10⁻¹⁶ cm2 at 74 eV, 6.1077 × 10⁻¹⁶ cm2 at 25 eV, and 4.6141 × 10⁻¹⁶ cm2 at 60 eV. When comparing DICS data with the electron impact TICS (not shown here), it was found that DICS are greater in magnitude. This is due to the absence of electron-electron exchange interaction (ln ti/ti + 1) in the BEB-0 model. We were unable to find positron impact DICS for these molecules in the literature.
Occupied molecular orbitals for SiC.
Partial ionization cross-sections and Arrhenius parameters for SiC.
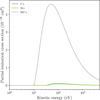 |
Fig. 10 PICS of cations dissociating from SiC: present calculations of SiC+ (solid gray line), Si+ (solid light green line), and C+ (solid teal line). |
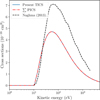 |
Fig. 11 TICS of SiC: present data (solid blue line), summation of calculated PICS (dashed dotted red line), and Naghma & Antony (2013) data (dashed black line). |
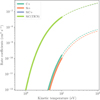 |
Fig. 12 Rate constants of the cations of SiC: C+ (teal), Si+ (coral), and SiC+ (light blue). Rates of TICS of SiC (light green). The solid curves represent the rates calculated using the MB distribution, dashed lines represent the extrapolated data using the modified Arrhenius equation. |
4 Conclusion
We present the electron impact total ionization cross-sections and dissociative ionization cross-sections of several cations arising from the neutral diatomic and triatomic molecules: LiH, SiC, H2S, and OCS. We also compare our PICS calculations of H2S and OCS with the measurements reported by Lindsay et al. (2003); Wang & Vidal (2003); Rao & Srivastava (1993), and Lomas et al. (2024). With respect to LiH and SiC, this work is the first to present such a dataset. The importance of the scaling factor for Z > 10 atoms has been explored for molecules with heavier sulfur, as well as the silicon atom. Our total ionization cross-sections of LiH display a plausible agreement with the results reported by Umer et al. (2025). We also calculated the corresponding rate coefficients for partial and total ionization cross-sections for the electron impact. Finally, the direct ionization cross-sections presented here comprise the first such data in the literature with respect to positron scattering. We believe our findings are useful in the context of building astrochemical networks.
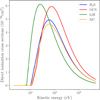 |
Fig. 13 DICS of H2S (solid blue line), OCS (solid red line), LiH (solid green line), and SiC (solid orange line). |
Data availability
The datasets generated during this study are available on Zenodo at https://doi.org/10.5281/zenodo.18741715.
Acknowledgements
D.G. acknowledges the Science and Engineering Research Board (SERB), Department of Science and Technology (DST), Government of India (Grant No. SRG/2022/000394) for providing a computing facility. This work was financially supported by Vellore Institute of Technology (VIT), Vellore under the Faculty Seed Grant (RGEMS) (Sanction Order No.: SG20250016). SS acknowledges the COST Action CA21126 Carbon molecular nanostructures in space (NanoSpace).
References
- Ali, M. A., & Kim, Y.-K. 2008, J. Phys. B: At. Mol. Opt. Phys., 41, 145202 [Google Scholar]
- Bougleux, E., & Galli, D. 1997, MNRAS, 288, 638 [NASA ADS] [Google Scholar]
- Cernicharo, J., Gottlieb, C. A., Guelin, M., Thaddeus, P., & Vrtilek, J. M. 1989, ApJ, 341, L25 [NASA ADS] [CrossRef] [Google Scholar]
- Dalgarno, A., Kirby, K., & Stancil, P. C. 1996, ApJ, 458, 397 [Google Scholar]
- Douglas, D. J., Frank, A. J., & Mao, D. 2005, Mass Spectrom. Rev., 24, 1 [Google Scholar]
- Dragoljub S, B., & Milan V, K. 1985, Fizika, 17, 117 [Google Scholar]
- Fedus, K., & Karwasz, G. P. 2019, Phys. Rev. A, 100, 062702 [Google Scholar]
- Franz, M., Wiciak-Pawłowska, K., & Franz, J. 2021, Atoms, 9, 99 [Google Scholar]
- Gaches, B. A. L., Grassi, T., Vogt-Geisse, S., et al. 2024, A&A, 684, A41 [NASA ADS] [CrossRef] [EDP Sciences] [Google Scholar]
- Graves, V. 2024, Eur. Phys. J. D, 78, 56 [Google Scholar]
- Graves, V., Cooper, B., & Tennyson, J. 2022, J. Phys. B: At. Mol. Opt. Phys., 54, 235203 [Google Scholar]
- Gupta, D., Choi, H., Song, M.-Y., Karwasz, G. P., & Yoon, J.-S. 2017, Eur. Phys. J. D, 71, 1 [Google Scholar]
- Heikkilä, A., Johansson, L. E. B., & Olofsson, H. 1999, A&A, 344, 817 [NASA ADS] [Google Scholar]
- Huber, S. E., Mauracher, A., Süß, D., et al. 2019, J. Chem. Phys., 150, 024306 [Google Scholar]
- Hudson, J. E., Hamilton, M. L., Vallance, C., & Harland, P. W. 2003, Phys. Chem. Chem. Phys., 5, 3162 [Google Scholar]
- Huo, W. M., & Kim, Y.-K. 2000, Chem. Phys. Lett., 319, 576 [Google Scholar]
- Janev, R. K., & Reiter, D. 2004, Phys. Plasmas, 11, 780 [Google Scholar]
- Jefferts, K. B., Penzias, A. A., Wilson, R. W., & Solomon, P. M. 1971, ApJ, 168, L111 [NASA ADS] [CrossRef] [Google Scholar]
- Karwasz, G. P., Możejko, P., & Song, M.-Y. 2014, Int. J. Mass Spectrom., 365, 232 [Google Scholar]
- Kim, Y.-K., & Rudd, M. E. 1994, Phys. Rev. A, 50, 3954 [NASA ADS] [CrossRef] [Google Scholar]
- Kim, Y.-K., Hwang, W., Weinberger, N. M., Ali, M. A., & Rudd, M. E. 1997, J. Chem. Phys., 106, 1026 [NASA ADS] [CrossRef] [Google Scholar]
- Lindsay, B. G., Rejoub, R., & Stebbings, R. F. 2003, J. Chem. Phys., 118, 5894 [Google Scholar]
- Linstrom, P. J., & Mallard, W. G. 2001, J. Chem. Eng. Data, 46, 1059 [CrossRef] [Google Scholar]
- Lomas, J., Heathcote, D., Loja, A. D. M., et al. 2024, J. Phys. B: At. Mol. Opt. Phys., 58, 015202 [Google Scholar]
- MacKay, D. D. S., & Charnley, S. B. 1999, MNRAS, 302, 793 [NASA ADS] [CrossRef] [Google Scholar]
- Mahla, S., & Antony, B. 2025, MNRAS, 538, 2693 [Google Scholar]
- Maoli, R., Melchiorri, F., & Tosti, D. 1994, ApJ, 425, 372 [NASA ADS] [CrossRef] [Google Scholar]
- Maoli, R., Ferrucci, V., Melchiorri, F., Signore, M., & Tosti, D. 1996, ApJ, 457, 1 [NASA ADS] [CrossRef] [Google Scholar]
- Marinković, B. P., Sreckovic, V. A., Dujko, S., et al. 2025, Phys. Scr. 100, 072002 [Google Scholar]
- Masuoka, T., & Doi, H. 1993, Phys. Rev. A, 47, 278 [Google Scholar]
- McCarthy, M. C., Apponi, A. J., Gottlieb, C. A., & Thaddeus, P. 2000, ApJ, 538, 766 [Google Scholar]
- McCarthy, M. C., Gottlieb, C. A., & Thaddeus, P. 2003, Mol. Phys., 101, 697 [Google Scholar]
- McGuire, B. A. 2018, ApJS, 239, 17 [Google Scholar]
- McGuire, B. A. 2022, ApJS, 259, 30 [NASA ADS] [CrossRef] [Google Scholar]
- Naghma, R., & Antony, B. 2013, Mol. Phys., 111, 269 [Google Scholar]
- Peebles, P. J. E. 2020, Principles of Physical Cosmology (Princeton: Princeton University Press) [Google Scholar]
- Penzias, A. A., Solomon, P. M., Wilson, R. W., & Jefferts, K. B. 1971, ApJ, 168, L53 [Google Scholar]
- Rao, M. V. V. S., & Srivastava, S. K. 1993, J. Geophys. Res. Planets, 98, 13137 [Google Scholar]
- Shanmugasundaram, S., Agrawal, R., & Gupta, D. 2024, J. Chem. Phys., 160, 094306 [Google Scholar]
- Schippers, S., Sokell, E., Aumayr, F., et al. 2019, J. Phys. B: At. Mol. Opt. Phys., 52, 171002 [Google Scholar]
- Shelat, F. A., Joshipura, K. N., Baluja, K. L., Bhowmik, P., & Kothari, H. N. 2011, Indian J. Phys., 85, 1739 [Google Scholar]
- Siegert, T. 2023, Astrophys. Space Sci., 368, 27 [NASA ADS] [CrossRef] [Google Scholar]
- Smith, D. G. A., Burns, L. A., Simmonett, A. C., et al. 2020, J. Chem. Phys., 152, 184108 [NASA ADS] [CrossRef] [Google Scholar]
- Stancil, P. C., Lepp, S., & Dalgarno, A. 1996, ApJ, 458, 401 [Google Scholar]
- Sun, Q., Berkelbach, T. C., Blunt, N. S., et al. 2018, Wiley Interdiscip. Rev. Comput. Mol. Sci., 8, e1340 [Google Scholar]
- Sun, Q., Zhang, X., Banerjee, S., et al. 2020, J. Chem. Phys., 153, 024109 [Google Scholar]
- Thaddeus, P., Kutner, M. L., Penzias, A. A., Wilson, R. W., & Jefferts, K. B. 1972, ApJ, 176, L73 [NASA ADS] [CrossRef] [Google Scholar]
- Umer, H., Scarlett, L. H., Singor, A. J. C., et al. 2025, Phys. Rev. A, 111, 022810 [Google Scholar]
- Vinodkumar, M., Bhutadia, H., Limbachiya, C., & Joshipura, K. N. 2011, Int. J. Mass Spectrom., 308, 35 [Google Scholar]
- Wang, P., & Vidal, C. R. 2003, J. Chem. Phys., 118, 5383 [Google Scholar]
- Werner, H.-J., Knowles, P. J., Knizia, G., Manby, F. R., & Schütz, M. 2012, Wiley Interdiscip. Rev. Comput. Mol. Sci., 2, 242 [CrossRef] [Google Scholar]
All Tables
All Figures
|
Fig. 1 PICS of cations dissociating from H2S: present data (solid red line) compared with the measurements from (Rao & Srivastava 1993, lilac upright triangles) and Lindsay et al. (2003, green squares). |
| In the text | |
|
Fig. 2 TICS of H2S: present TICS (Solid blue line), Present TICS where the kinetic energy of the HOMO / 3 (dashed grey line), Summation of all calculated PICS (dashed coral colored line), Recommended data from the ALeCS database from Gaches et al. (2024) (dashed-dotted green line); Linstrom & Mallard (2001) NIST BEB data (solid pink line); Vinodkumar et al. (2011) BEB data (Solid orange line); Kim et al. (1997) BEB data and Kim et al. (1997) BEB data scaled with the kinetic energy of the HOMO / 3 (dashed brown line); Dragoljub S & Milan V (1985) measurements (black diamond); Lindsay et al. (2003) measurements (green squares); and Rao & Srivastava (1993) measurements (upright lilac triangles). |
| In the text | |
|
Fig. 3 Rate constants of the cations of H2S: solid curves show the rates calculated using the MB distribution. Dashed lines show the extrapolated data using the modified Arrhenius equation. |
| In the text | |
|
Fig. 4 PICS of cations dissociating from OCS: present calculation (solid red line), Lomas et al. (2024) measurements (blue upright triangles), our PICS calculation at 200 eV (yellow circles), and Wang & Vidal (2003) measurements at 200 eV (black diamonds). |
| In the text | |
|
Fig. 5 TICS of OCS: present data (solid red line), summation of all calculated PICS (solid green line), Lomas et al. (2024) measurements (upright triangle), Gaches et al. (2024) CCSD(T) calculations (dashed purple line), Hudson et al. (2003) BEB data (dashed blue line), Wang & Vidal (2003) measurement and BEB data at 200 eV (black diamond and blue cross), Kim et al. (1997) BEB calculation (dashed black line), and the Kim et al. (1997) measurements (orange circles) based on the Srivastava data. |
| In the text | |
|
Fig. 6 Rate constants of the cations of OCS: solid curves show the rates calculated using the MB distribution. Dashed lines show the extrapolated data using the modified Arrhenius equation. |
| In the text | |
|
Fig. 7 PICS of cations dissociating from LiH: present calculations of LiH+ (solid gray line), Li+ (solid light green line), and H+ (solid dark green line). |
| In the text | |
|
Fig. 8 LiH TICS: the present BEB calculation (solid purple line); summation of the PICS (dashed black line); Umer et al. (2025) MCCC (dashed green line); Umer et al. (2025) BE-scaled cross-section (dashed magenta line); Shelat et al. (2011) csp-ic model A (dashed yellow line); Shelat et al. (2011); csp-ic model B (dashed pink line); Umer et al. (2025) MCCC Born-corrected (dashed light blue line). |
| In the text | |
|
Fig. 9 Rate constants of the cations of LiH: solid curves show the rates calculated using the MB distribution. Dashed lines show the extrapolated data using the modified Arrhenius equation. |
| In the text | |
|
Fig. 10 PICS of cations dissociating from SiC: present calculations of SiC+ (solid gray line), Si+ (solid light green line), and C+ (solid teal line). |
| In the text | |
|
Fig. 11 TICS of SiC: present data (solid blue line), summation of calculated PICS (dashed dotted red line), and Naghma & Antony (2013) data (dashed black line). |
| In the text | |
|
Fig. 12 Rate constants of the cations of SiC: C+ (teal), Si+ (coral), and SiC+ (light blue). Rates of TICS of SiC (light green). The solid curves represent the rates calculated using the MB distribution, dashed lines represent the extrapolated data using the modified Arrhenius equation. |
| In the text | |
|
Fig. 13 DICS of H2S (solid blue line), OCS (solid red line), LiH (solid green line), and SiC (solid orange line). |
| In the text | |
Current usage metrics show cumulative count of Article Views (full-text article views including HTML views, PDF and ePub downloads, according to the available data) and Abstracts Views on Vision4Press platform.
Data correspond to usage on the plateform after 2015. The current usage metrics is available 48-96 hours after online publication and is updated daily on week days.
Initial download of the metrics may take a while.