Fig. B.1.
Download original image
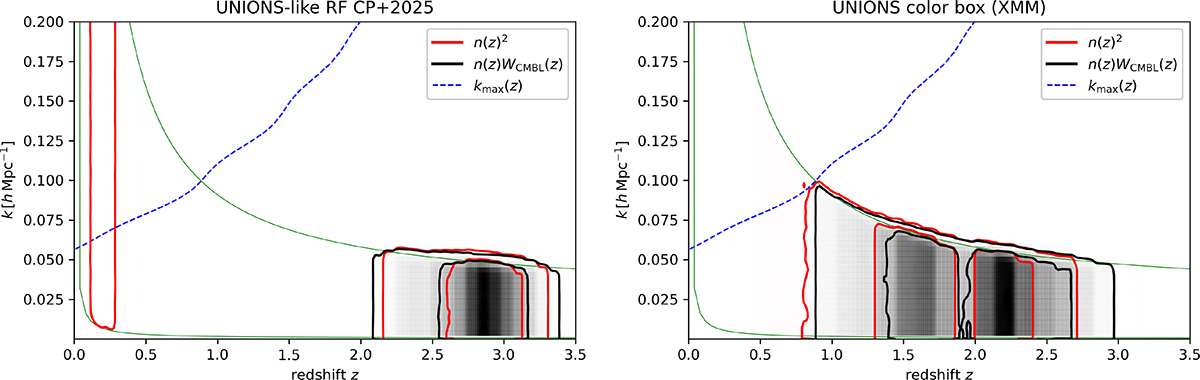
Wavelength k − z plane. The region between the two green lines corresponds to all possible scales probed by the LBG samples. The area above the dashed blue line indicates non-linear scales. Left: The red (black) distribution shows the 1-2σ weighted k − z map following n(z)2 (n(z)Wκ(z), respectively) of the RF UNIONS-like selection from Payerne et al. (2025). Right: Same as the left plot, but for the UNIONS color-cut LBG selection.
Current usage metrics show cumulative count of Article Views (full-text article views including HTML views, PDF and ePub downloads, according to the available data) and Abstracts Views on Vision4Press platform.
Data correspond to usage on the plateform after 2015. The current usage metrics is available 48-96 hours after online publication and is updated daily on week days.
Initial download of the metrics may take a while.