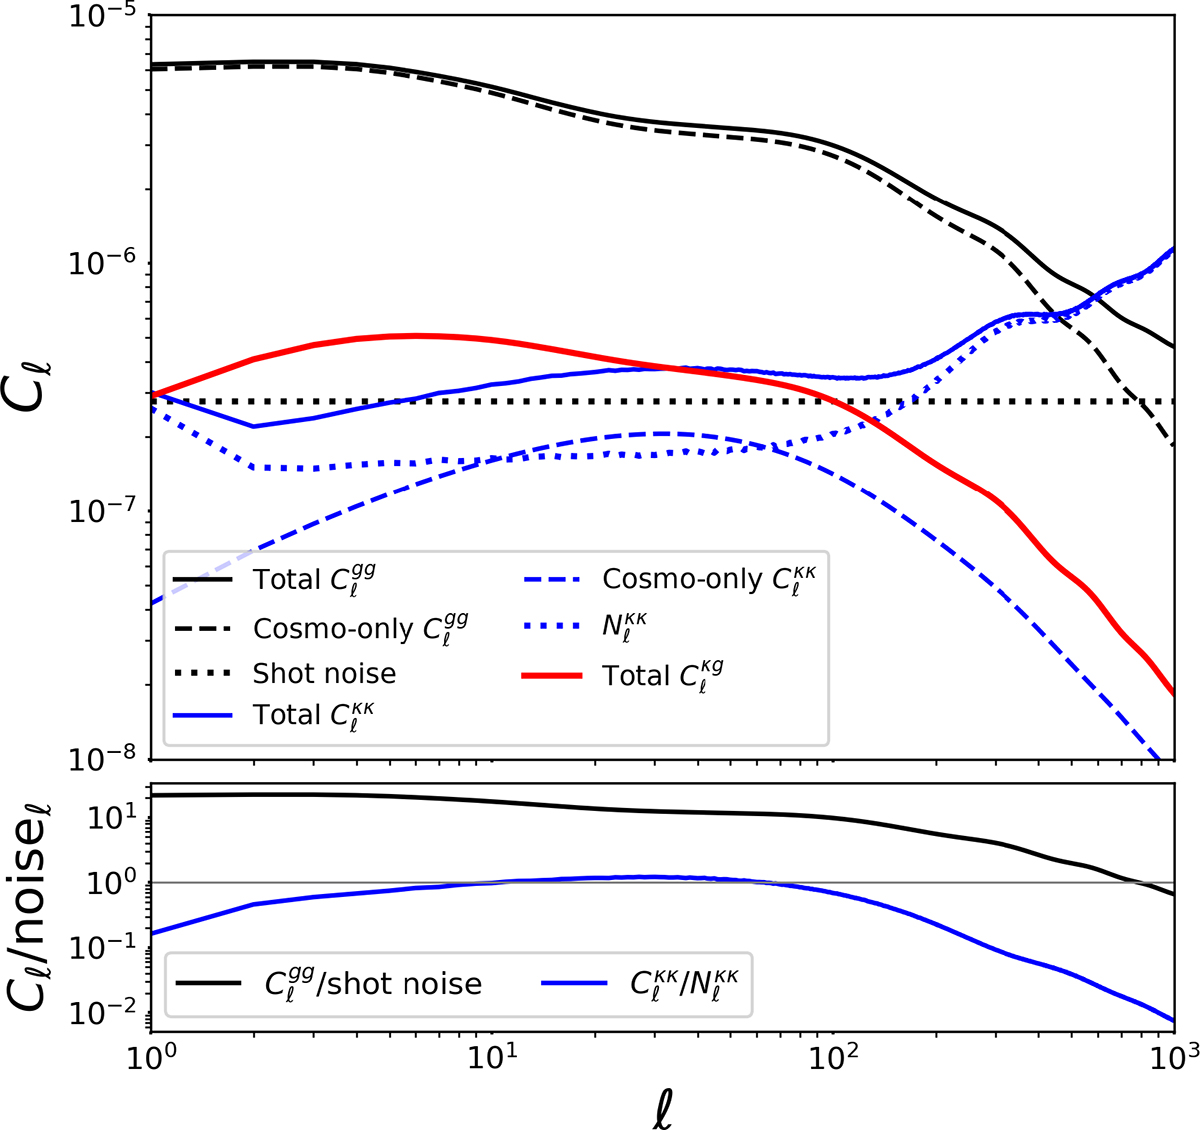
Fig. 2.
Download original image
Top panel shows the angular power spectra Cℓgg, Cℓκg, and Cℓκκ (solid lines) for the baseline sample. The cosmological-only contribution is shown as dashed lines, while the noise contribution is shown as dotted lines. Bottom panel shows the signal-to-noise ratio, defined as the ratio of the cosmological-only term to the noise, for Cℓgg and Cℓκκ.
Current usage metrics show cumulative count of Article Views (full-text article views including HTML views, PDF and ePub downloads, according to the available data) and Abstracts Views on Vision4Press platform.
Data correspond to usage on the plateform after 2015. The current usage metrics is available 48-96 hours after online publication and is updated daily on week days.
Initial download of the metrics may take a while.