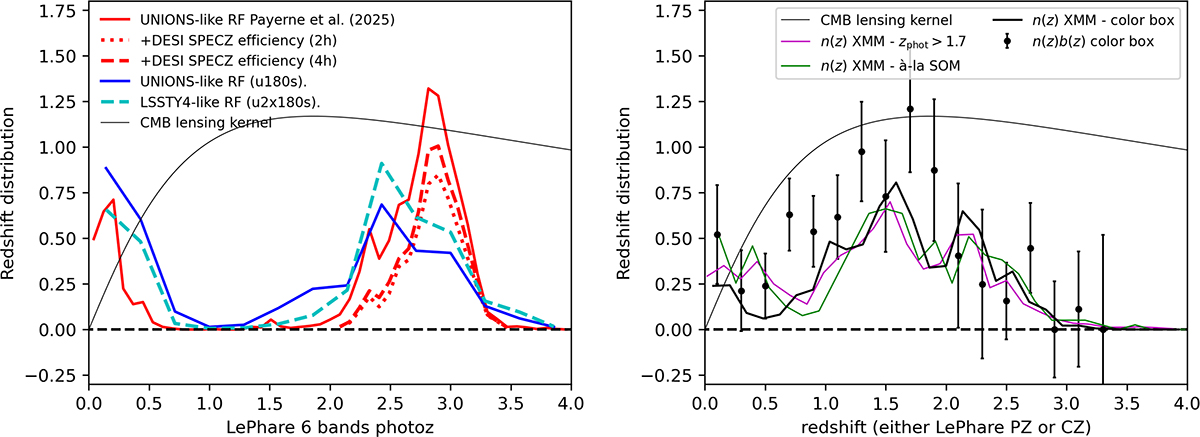
Fig. 1.
Download original image
Left: Photometric redshift distributions of the photometric LBG samples UNIONSlike_RF in red (the convolution of the UNIONSlike_RF distribution with the DESI spectroscopic efficiency is shown in dashed and dotted lines, they have not been normalized to show the impact at z ∼ 2.5). The distribution of the samples UNIONSlike_RF_u180s, and LSSTY4like_RF_u2x180s are shown in blue and dashed cyan lines. Right: Photometric redshift distributions of the UNIONS LBG samples UNIONS_colorcut and UNIONS_PZcut in the XMM field. The sample selected with the hybrid method à-la SOM is shown for illustration. We also show the quantity nb (the product between the large-scale bias and the normalized redshift distribution) resulting from our clustering-redshift calibration methods.
Current usage metrics show cumulative count of Article Views (full-text article views including HTML views, PDF and ePub downloads, according to the available data) and Abstracts Views on Vision4Press platform.
Data correspond to usage on the plateform after 2015. The current usage metrics is available 48-96 hours after online publication and is updated daily on week days.
Initial download of the metrics may take a while.