Open Access
Fig. 8
Download original image
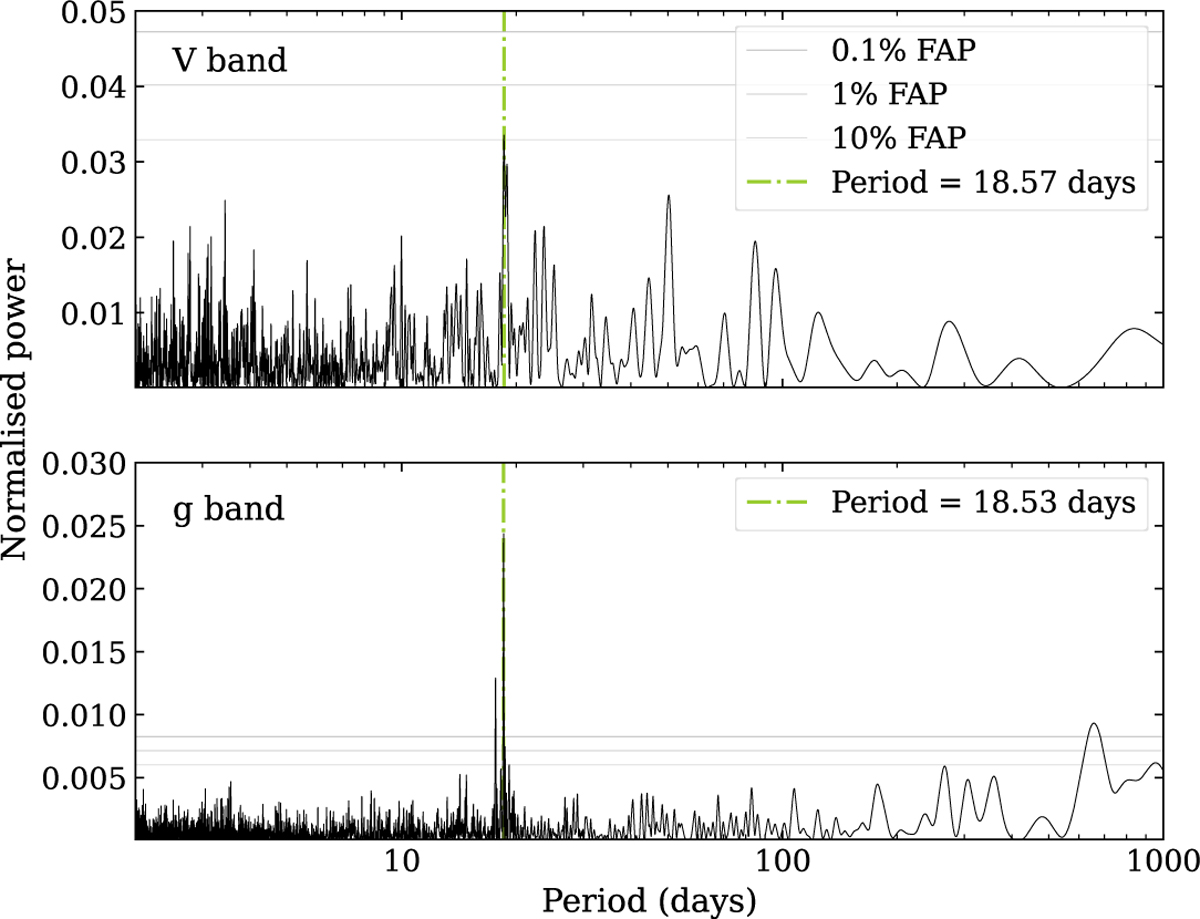
Lomb-Scargle periodograms of the V band (top panel) and g′ band (bottom panel) photometry from ASAS-SN. The photometry are described in Section 3.3. The period of the highest peak is highlighted by a dash-dot green line, and it likely corresponds to the stellar rotation period.
Current usage metrics show cumulative count of Article Views (full-text article views including HTML views, PDF and ePub downloads, according to the available data) and Abstracts Views on Vision4Press platform.
Data correspond to usage on the plateform after 2015. The current usage metrics is available 48-96 hours after online publication and is updated daily on week days.
Initial download of the metrics may take a while.