Fig. 5
Download original image
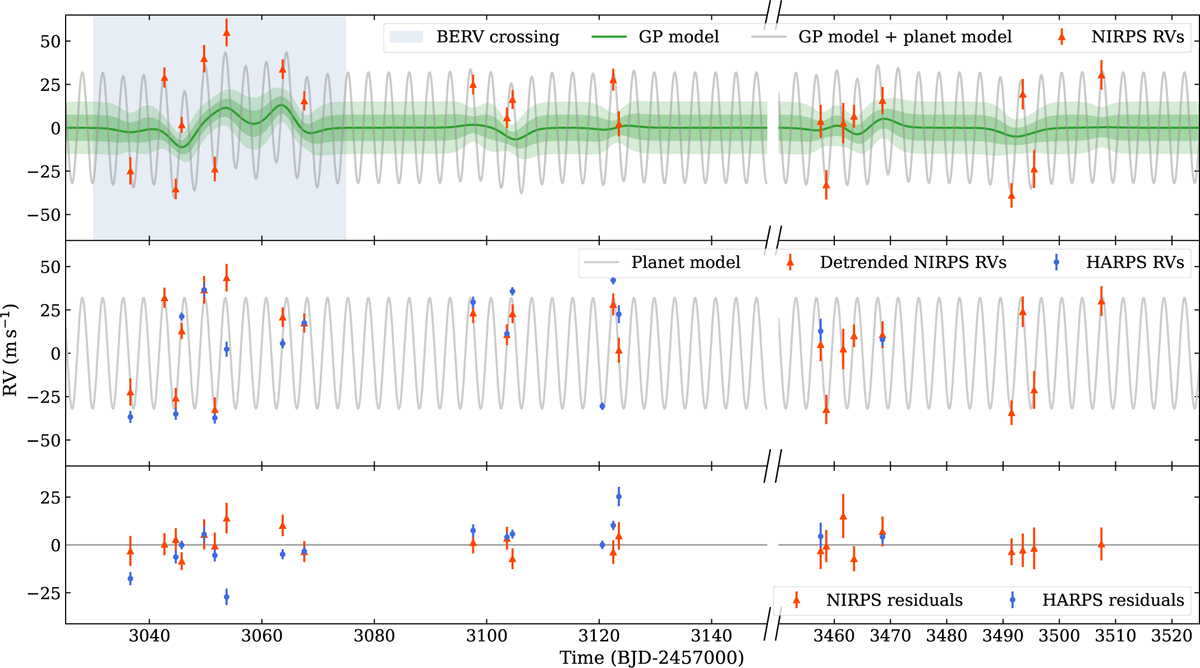
Data from NIRPS and HARPS for TOI-672. The data are described in Section 2.4, and the fit to these data are described in Section 4.3. Top panel : NIRPS RVs (red triangles), the GP model fit to the NIRPS RVs (green line, with the one and two standard deviations of the fit shaded), and the combined GP and planet model (grey line). The BERV crossing event described in Section 2.4 is shaded in blue. Middle panel : both sets of RVs. Here, NIRPS has been detrended with a GP, and HARPS (blue circles) has no detrending. The planet-only model is shown with a grey line. Bottom panel : radial velocity residuals after the GP and planet models have been subtracted.
Current usage metrics show cumulative count of Article Views (full-text article views including HTML views, PDF and ePub downloads, according to the available data) and Abstracts Views on Vision4Press platform.
Data correspond to usage on the plateform after 2015. The current usage metrics is available 48-96 hours after online publication and is updated daily on week days.
Initial download of the metrics may take a while.