Fig. C.1
Download original image
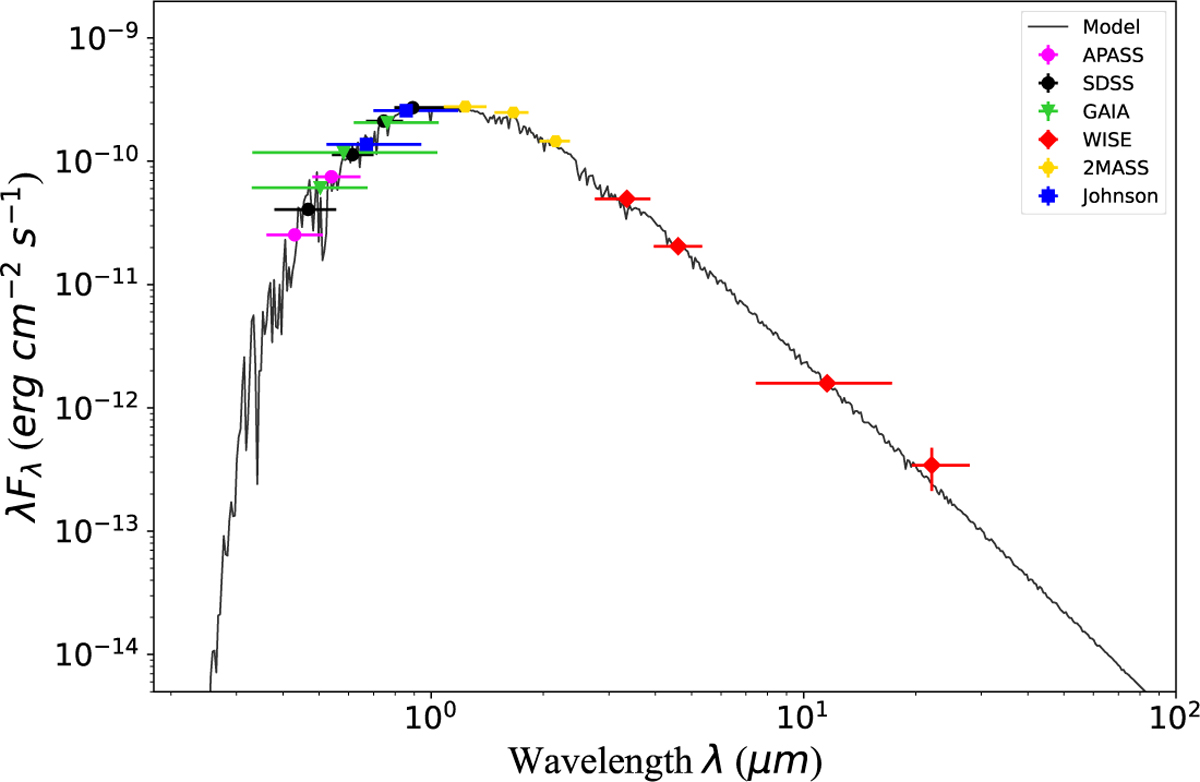
Spectral energy distribution of TOI-672, described in Section 3.1.4, assembled from broadband photometry obtained with APASS (magenta), SDSS (black), Gaia (green), 2MASS (yellow), WISE (red), and the Johnson system (blue). The horizontal bars indicate the effective wavelength ranges of each filter. The SED is fitted with a BT-Settl atmospheric model (Allard et al. 2012).
Current usage metrics show cumulative count of Article Views (full-text article views including HTML views, PDF and ePub downloads, according to the available data) and Abstracts Views on Vision4Press platform.
Data correspond to usage on the plateform after 2015. The current usage metrics is available 48-96 hours after online publication and is updated daily on week days.
Initial download of the metrics may take a while.