Fig. B.1
Download original image
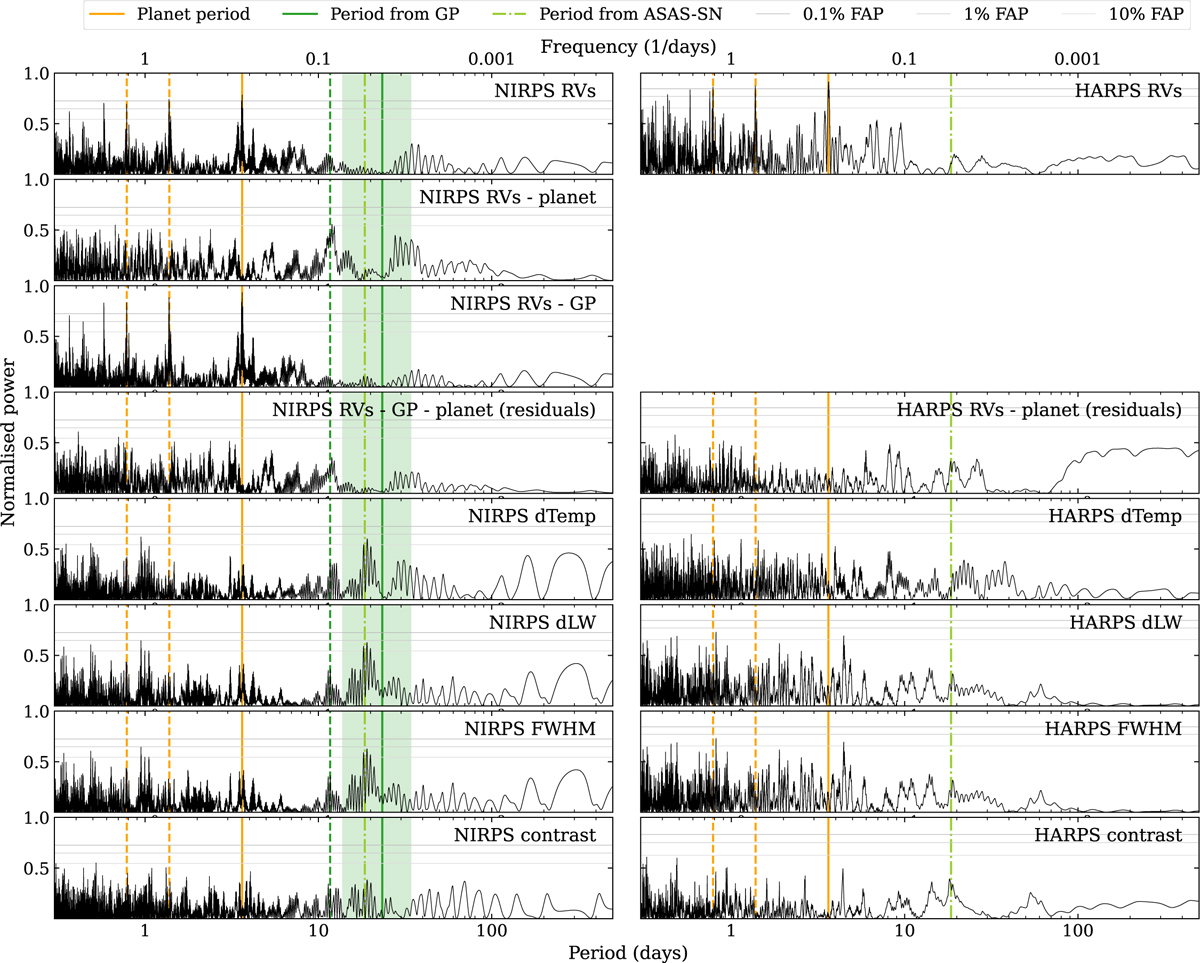
Lomb-Scargle periodograms (black lines) of the NIRPS (left column) and HARPS (right column) data. The best-fit period of TOI-672 b is shown (solid vertical orange line), along with its aliases (dashed orange lines). The recurrence timescale fit by the GP used on the NIRPS data (solid vertical green lines) is shown, along with the 1 standard deviation error (shaded green), and half the recurrence timescale (dashed vertical green line). The 0.1, 1, and 10% False Alarm Probabilities (FAPs, solid horizontal lines from dark to light grey) are calculated using the approximation from Baluev (2008). We describe the panels from top to bottom. First row: the RVs prior to detrending, clearly showing signals above the 0.1 % FAP thresholds at the planetary period (and its aliases). Second row: the NIRPS RVs with the planet signal removed. Third row: the NIRPS RVs detrended with the GP, where the significance of the planet signals has increased. Fourth row: the residual RVs after detrending (only in the case of the NIRPS RVs) and subtraction of the planet model, showing no further significant signals. Fifth to eighth rows: the dTemp, dLW, FWHM, and contrast activity indicators, respectively (all activity indicators are described in Section 2.4). None of the indicators show peaks at the planetary period. The NIRPS dTemp, dLW, and FWHM show a peak around 20 days of some significance (discussed in Section 3.3), and corresponding peaks at 20 days do also appear in all the HARPS activity indicators, though they are not significant.
Current usage metrics show cumulative count of Article Views (full-text article views including HTML views, PDF and ePub downloads, according to the available data) and Abstracts Views on Vision4Press platform.
Data correspond to usage on the plateform after 2015. The current usage metrics is available 48-96 hours after online publication and is updated daily on week days.
Initial download of the metrics may take a while.