Fig. 2
Download original image
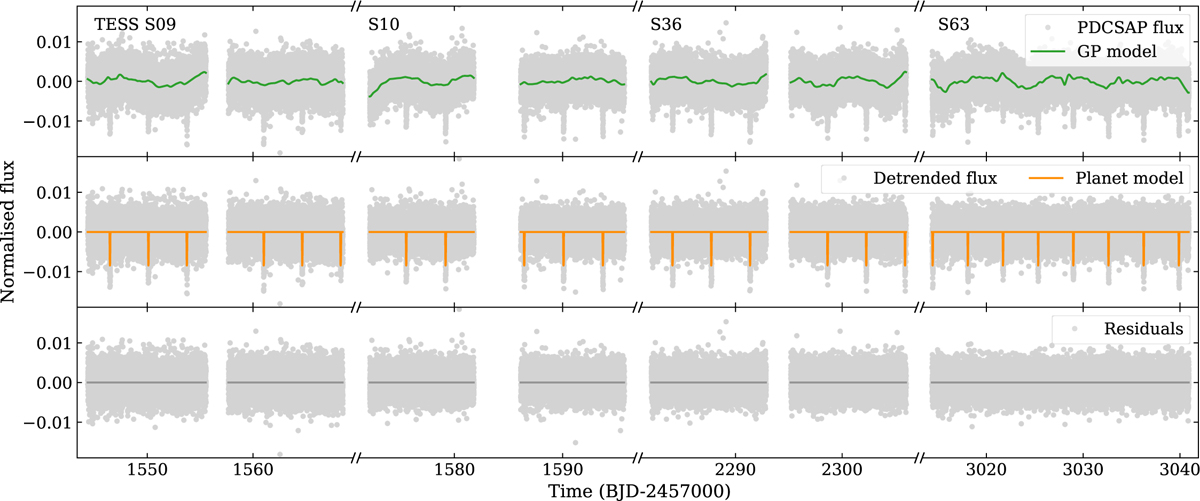
TESS photometry for TOI-672 covering Sectors 9, 10, 36, and 63 (left to right, chronologically). The data are described in Section 2.1, and the fit to these data is described in Section 4.1. Top panel : PDCSAP flux (grey circles) and the GP model (green line) used for detrending. Middle panel : detrended flux after the GP model is subtracted and with the transit model shown (orange line). Bottom panel : residuals left after the GP and transit models are subtracted from the photometry.
Current usage metrics show cumulative count of Article Views (full-text article views including HTML views, PDF and ePub downloads, according to the available data) and Abstracts Views on Vision4Press platform.
Data correspond to usage on the plateform after 2015. The current usage metrics is available 48-96 hours after online publication and is updated daily on week days.
Initial download of the metrics may take a while.