Fig. A.3
Download original image
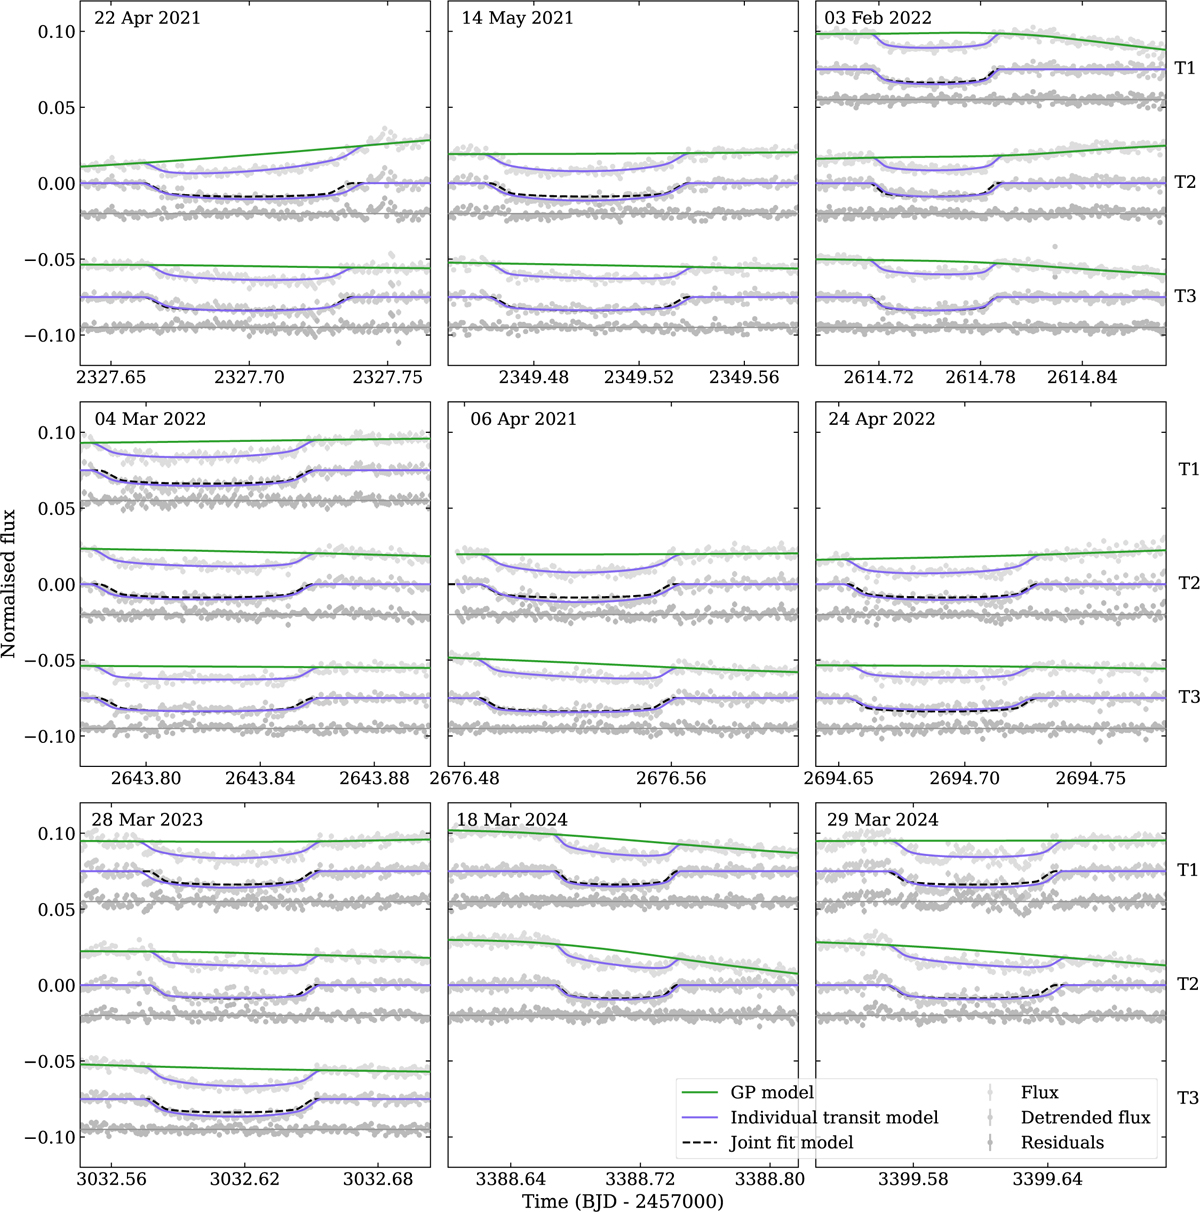
Photometry from ExTrA described in Section 2.2.2, where each panel is from a single observation night which is labelled. In each panel, observations can come from Telescope 1 (T1, top row, overall offset by +0.075 in flux), Telescope 2 (T2, middle row, no overall offset in flux), and/or Telescope 3 (T3, bottom row, overall offset by -0.075 in flux). For each telescope, we display the extracted photometry (pale grey dots, offset by +0.02 in flux) which is detrended by a GP (green line), to produce the detrended photometry (medium grey dots, no offset in flux), and then the individual transit model (purple line) is subtracted to show the residuals (dark grey dots, offset by -0.02 in flux). We also show the transit model from the joint fit (dashed black line, using the ExTrA limb darkening), which generally agrees well with the individual transit fits performed for the TTV search (purple line), see Section 5.5.
Current usage metrics show cumulative count of Article Views (full-text article views including HTML views, PDF and ePub downloads, according to the available data) and Abstracts Views on Vision4Press platform.
Data correspond to usage on the plateform after 2015. The current usage metrics is available 48-96 hours after online publication and is updated daily on week days.
Initial download of the metrics may take a while.