Fig. 12
Download original image
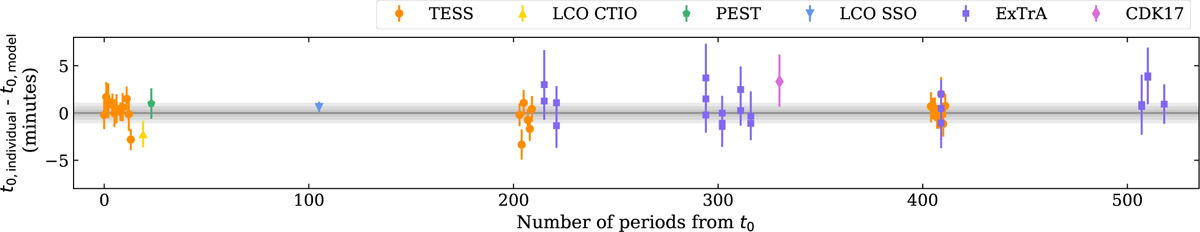
Searching for TTVs in the transits of TOI-672b. Mid-transit times from fits to each individual transit (described in Section 5.5) are compared to the linear ephemeris from the joint fit model (i.e. the dark grey line at y = 0 in this plot, where the 1, 2 and 3 standard deviations from the value are shaded). The TESS transits are shown as orange circles; the LCO CTIO transit is the yellow triangle; the PEST transit is the green pentagon; the LCO SSO transit is the blue upside down triangle; the ExTrA transits are purple squares; and the Deep Sky Chile CDK17 transit is the orchid coloured diamond.
Current usage metrics show cumulative count of Article Views (full-text article views including HTML views, PDF and ePub downloads, according to the available data) and Abstracts Views on Vision4Press platform.
Data correspond to usage on the plateform after 2015. The current usage metrics is available 48-96 hours after online publication and is updated daily on week days.
Initial download of the metrics may take a while.