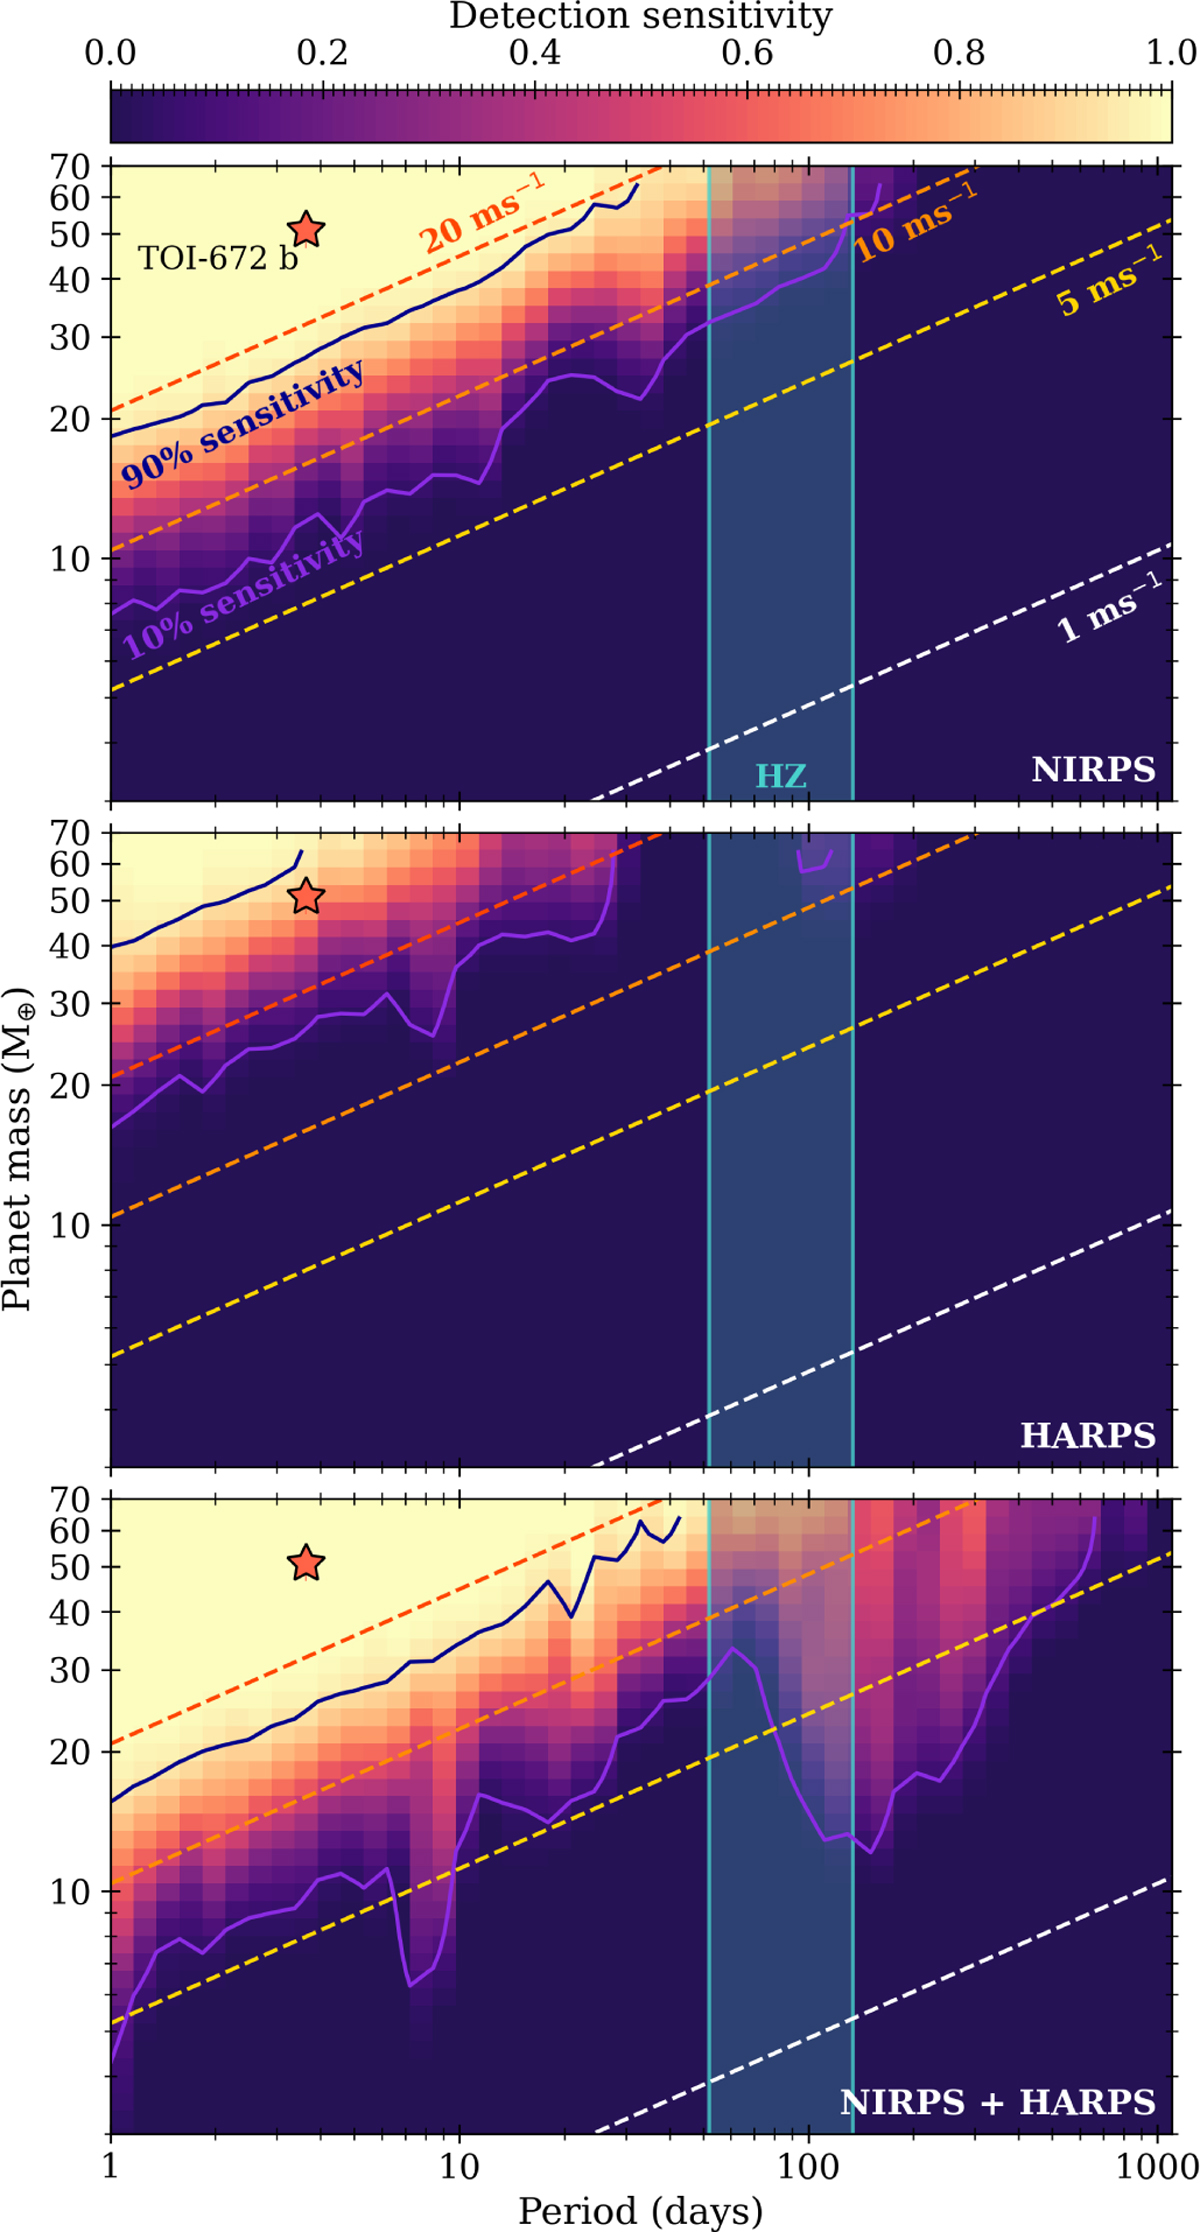
Fig. 11
Download original image
Sensitivity of the RV data, specifically the NIRPS data (top panel), HARPS data (middle panel), and combined NIRPS plus HARPS data (bottom panel), to additional planets orbiting TOI-672 as a function of planet mass and orbital period (using 50 × 50 bins in this parameter space). The calculation is described in Section 5.4. The sensitivity is shaded as in the colour bar, from 0 (dark purple) to 1 (light yellow). The 90 and 10% sensitivity limits are denoted by the dark purple and medium purple solid lines, respectively, and labelled in the top panel. The RV semi-amplitudes of 20, 10, 5, and 1 m s−1 are denoted by the red, orange, yellow, and white dashed lines, respectively, and labelled in the top panel. TOI-672 b is shown by the star marker (where error bars are too small to be seen). The habitable zone defined by Kopparapu et al. (2013), specifically the moist greenhouse inner edge and the maximum greenhouse outer edge calculated for the specific host star TOI-672, is shaded with a turquoise colour.
Current usage metrics show cumulative count of Article Views (full-text article views including HTML views, PDF and ePub downloads, according to the available data) and Abstracts Views on Vision4Press platform.
Data correspond to usage on the plateform after 2015. The current usage metrics is available 48-96 hours after online publication and is updated daily on week days.
Initial download of the metrics may take a while.