Fig. 10
Download original image
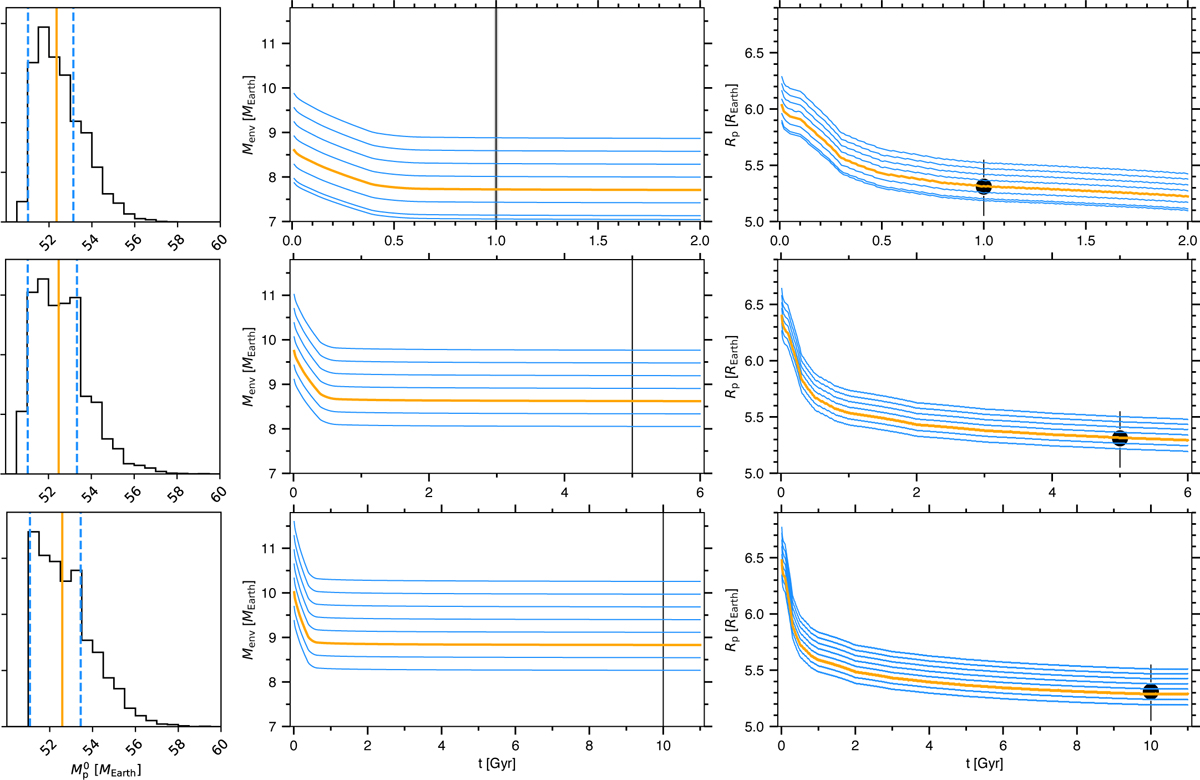
JADE exploration of TOI-672 b atmospheric evolution, assuming ages of 1, 5, and 10 Gyr (top, middle, and bottom rows, respectively). Left column : probability density function of the initial planet mass. The median is highlighted as an orange line, and the 1σ HDI interval is shown as dashed blue lines. Middle column : temporal evolution of the planet envelope mass in the best-fit simulation (orange curve) and a set of simulations from within the HDI interval (blue curves). The vertical black line with a grey shaded band marks the assumed age and uncertainties. Right column : same as the middle panel, but for the planet radius. The black point indicates the measured value.
Current usage metrics show cumulative count of Article Views (full-text article views including HTML views, PDF and ePub downloads, according to the available data) and Abstracts Views on Vision4Press platform.
Data correspond to usage on the plateform after 2015. The current usage metrics is available 48-96 hours after online publication and is updated daily on week days.
Initial download of the metrics may take a while.