


Fig. 9.
Download original image
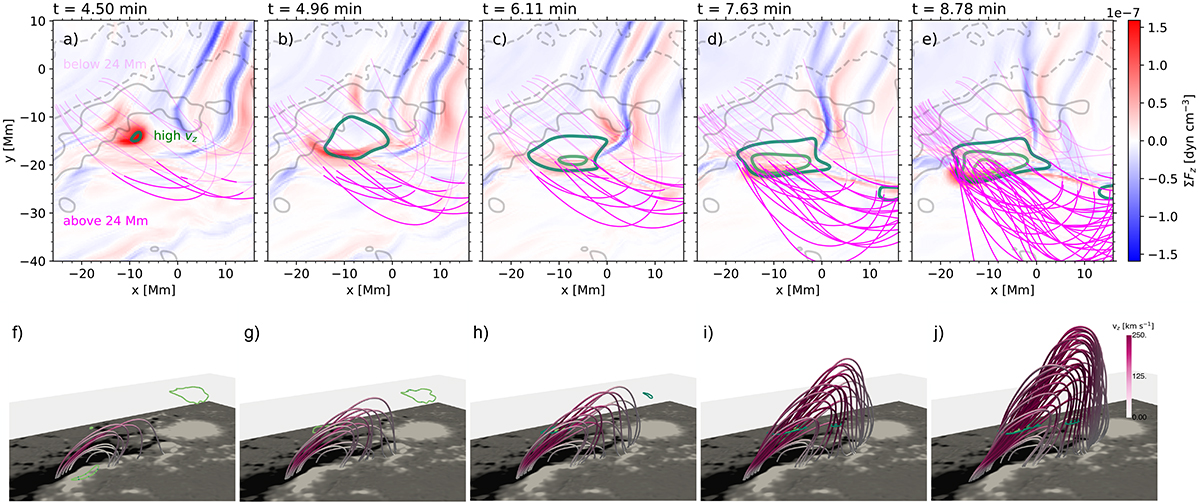
Top panels: Evolution of the net vertical force (positive values are plotted in red, and negative values are shown in blue) at z = 24 Mm for a) t = 4.5 min, b) t = 4.96 min, c) t = 6.11 min, d) t = 7.63 min, and e) t = 8.78 min. The magenta lines correspond to field lines computed within the flux rope. The grey contours indicate positive (solid) and negative (dashed) values of Bz at z = 0.05 Mm, and the green contours exhibit different values of vz between 218 (dark green) and 436 km s−1 (light green). Bottom panels: Flux rope magnetic field lines in 3D coloured by vz for the same times as in the top panels. The semi-transparent grey plane corresponds to z = 24 Mm and contains the same vz contours as the top panels.
Current usage metrics show cumulative count of Article Views (full-text article views including HTML views, PDF and ePub downloads, according to the available data) and Abstracts Views on Vision4Press platform.
Data correspond to usage on the plateform after 2015. The current usage metrics is available 48-96 hours after online publication and is updated daily on week days.
Initial download of the metrics may take a while.