


Fig. 6.
Download original image
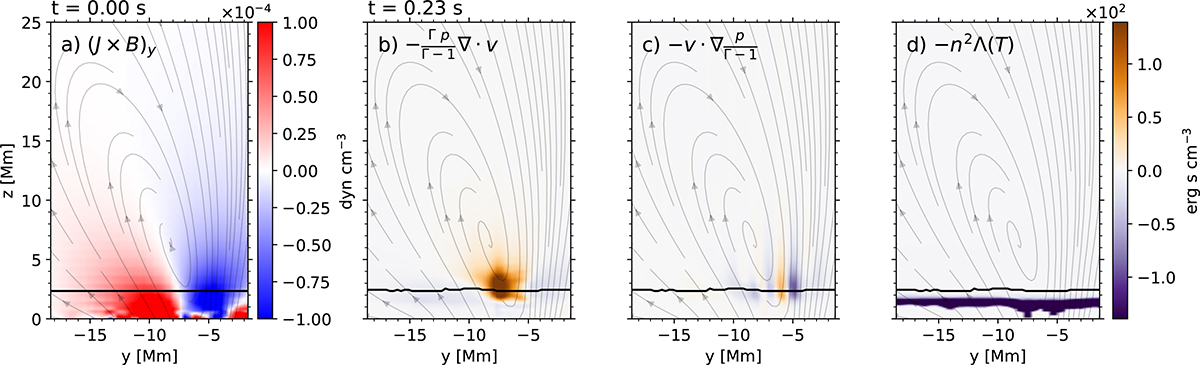
Lorentz force and energy source terms for the plane x = −15 Mm (see its photospheric trace C in Fig. 2). a) Lorentz force on the y-axis at t = 0 s (positive values are shown in red, and negative values are shown in blue), b) compression, c) advection, and d) radiative cooling at t = 0.23 s (positive values are indicated in dark orange, and negative values are shown in purple). The upper limit of the transition region is denoted with the solid black line.
Current usage metrics show cumulative count of Article Views (full-text article views including HTML views, PDF and ePub downloads, according to the available data) and Abstracts Views on Vision4Press platform.
Data correspond to usage on the plateform after 2015. The current usage metrics is available 48-96 hours after online publication and is updated daily on week days.
Initial download of the metrics may take a while.