


Fig. A.1.
Download original image
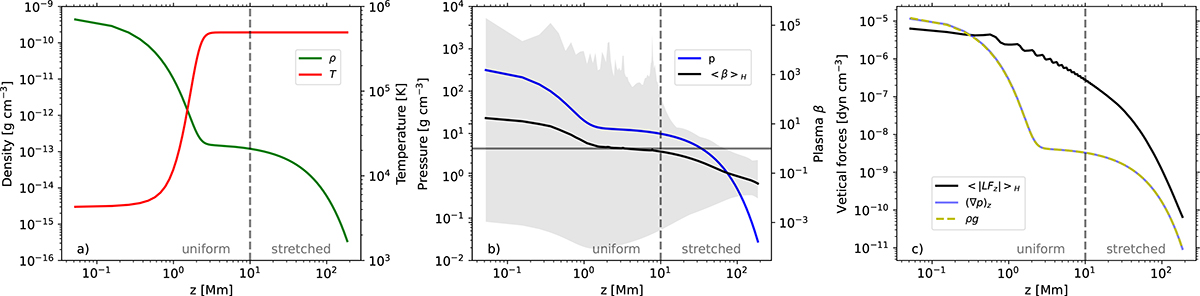
Vertical initial profiles. a) Density (ρ, green solid line) and temperature (T, red solid line) as function of height. b) Gas pressure (p, blue solid line) and horizontal average of plasma β (< β> H, black solid line). The grey area covers the minimum and the maximum values of β for each height. The horizontal grey line indicates β = 1. c) Initial forces: horizontal average of the vertical Lorentz force (< LFz> H, black solid line), gas pressure gradient ((∇p)z, blue solid line) and gravity (ρg, dashed yellow line). The vertical dashed grey line indicates the division between uniform and stretched grid in z.
Current usage metrics show cumulative count of Article Views (full-text article views including HTML views, PDF and ePub downloads, according to the available data) and Abstracts Views on Vision4Press platform.
Data correspond to usage on the plateform after 2015. The current usage metrics is available 48-96 hours after online publication and is updated daily on week days.
Initial download of the metrics may take a while.