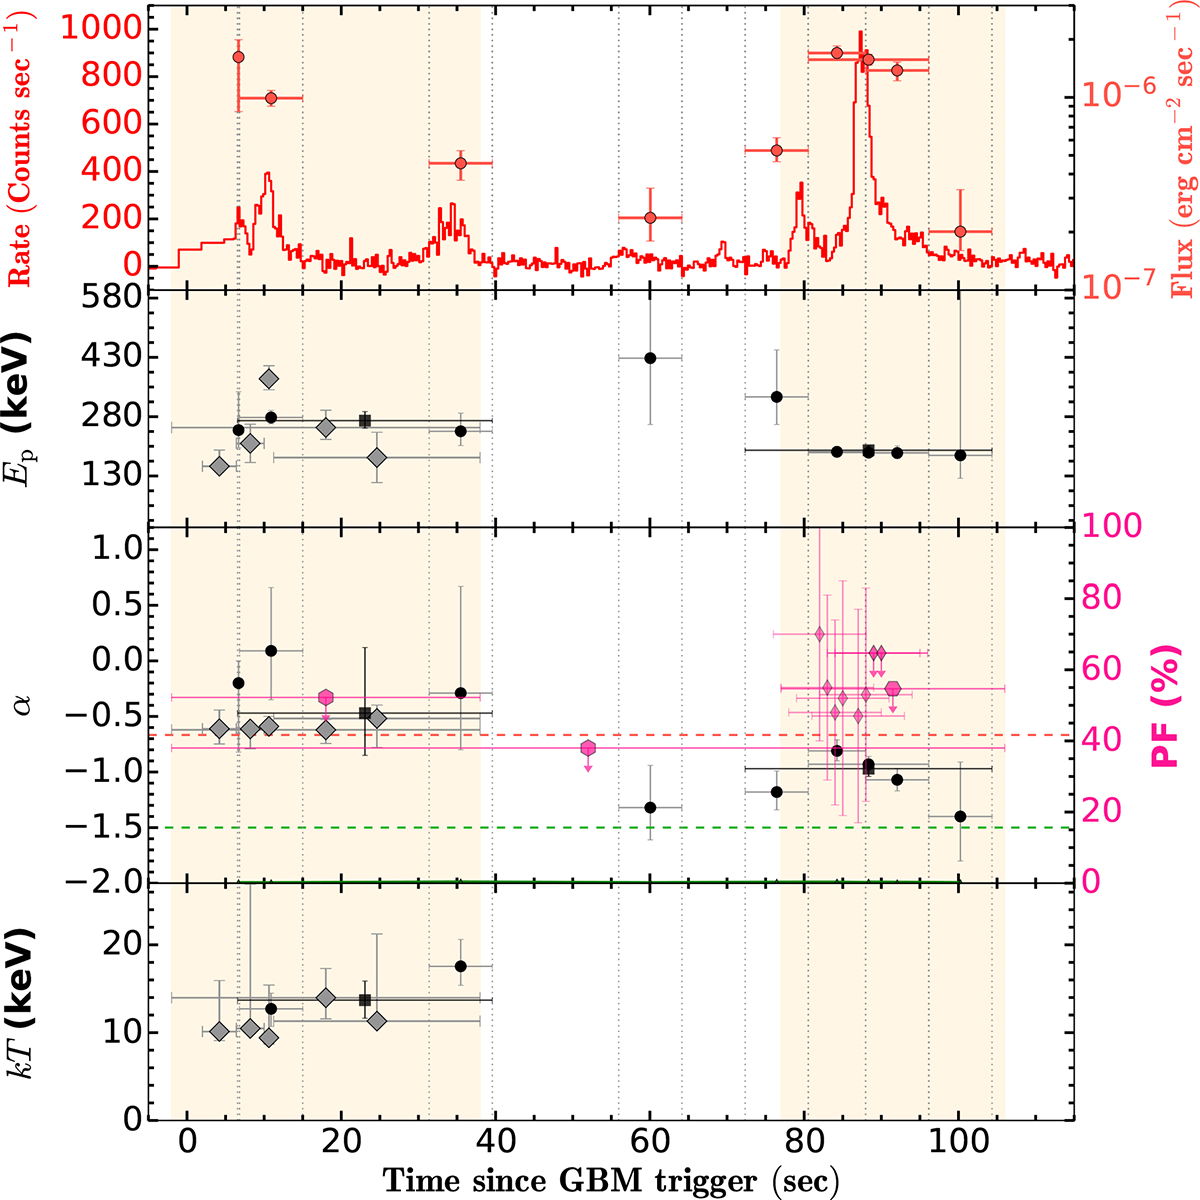
Fig. 5.
Download original image
Spectropolarimetric evolution of GRB 220107A: Time-resolved spectropolarimetric analysis of GRB 220107A. Top panel: Konus-Wind light curve in the 20–1300 keV band (red) with flux evolution (orange-red) shown on the right axis. Shaded regions indicate the two main episodes of the burst. Vertical dashed gray lines mark finer time bins used for spectral analysis using Konus-Wind data. Second panel: Evolution of Ep with time, showing the peak energy of the emission in each time bin. Third panel: Evolution of the low-energy spectral index α with synchrotron slow- (α = −2/3) and fast-cooling (α = −3/2) reference lines indicated by dashed lines. Pink points indicate the PF measured with AstroSat CZTI, including upper limits. Bottom panel: Evolution of the blackbody temperature kT for models including a thermal component. The combination of spectral and polarimetric measurements highlights the hard-to-soft evolution of the first to second episode and provides constraints on the emission mechanisms of GRB 220107A.
Current usage metrics show cumulative count of Article Views (full-text article views including HTML views, PDF and ePub downloads, according to the available data) and Abstracts Views on Vision4Press platform.
Data correspond to usage on the plateform after 2015. The current usage metrics is available 48-96 hours after online publication and is updated daily on week days.
Initial download of the metrics may take a while.