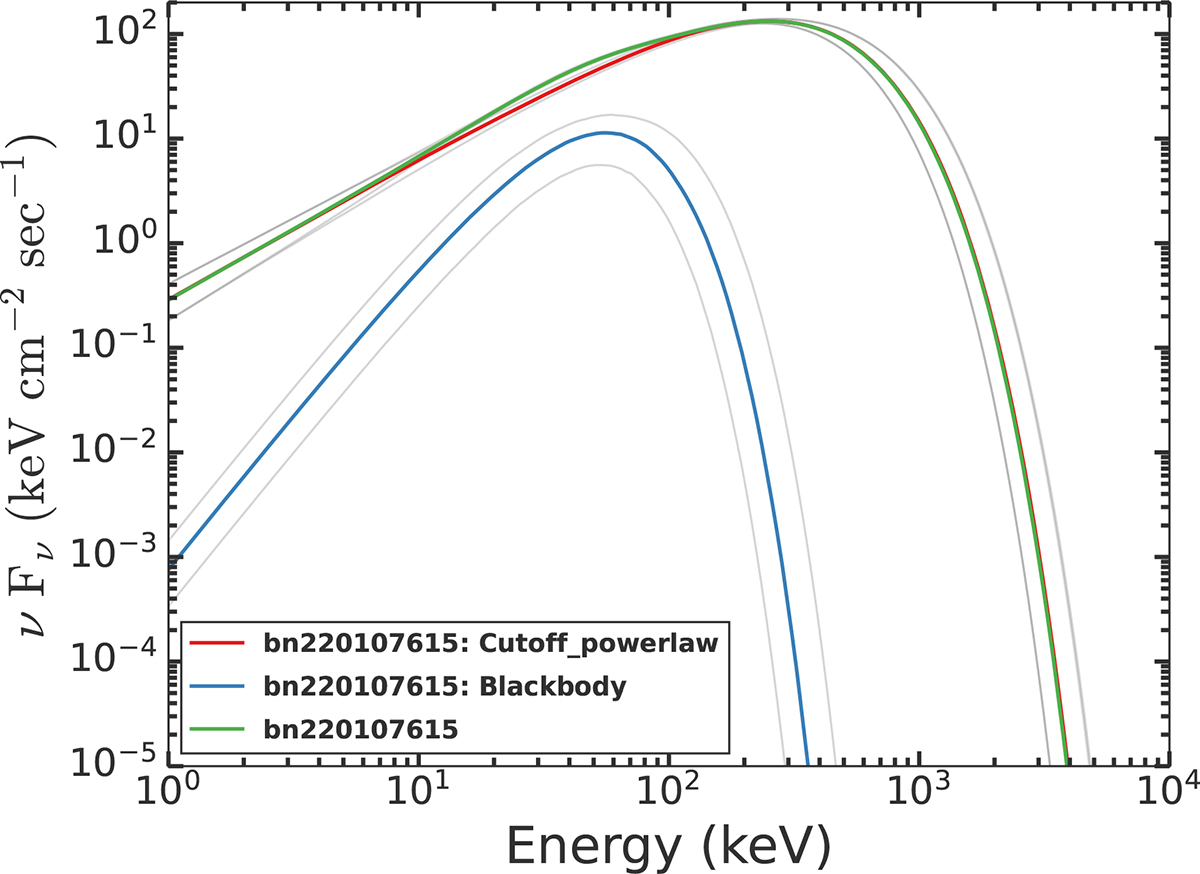
Fig. 4.
Download original image
Time-integrated νFν spectrum of GRB 220107A (episode 1; T0 − 2 to T0 + 38 s) fit with the cutoff power law plus blackbody (CPL+BB) model using Fermi/GBM data. The red curve shows the cutoff power law component, the blue curve shows the blackbody emission, and the green curve represents the total model. The shaded gray regions denote the 1σ uncertainties of each spectral component. The fit suggests a thermal blackbody component at kT ∼ 14 keV in addition to the nonthermal CPL continuum, which significantly improves the fit relative to purely nonthermal models.
Current usage metrics show cumulative count of Article Views (full-text article views including HTML views, PDF and ePub downloads, according to the available data) and Abstracts Views on Vision4Press platform.
Data correspond to usage on the plateform after 2015. The current usage metrics is available 48-96 hours after online publication and is updated daily on week days.
Initial download of the metrics may take a while.