Fig. 3.
Download original image
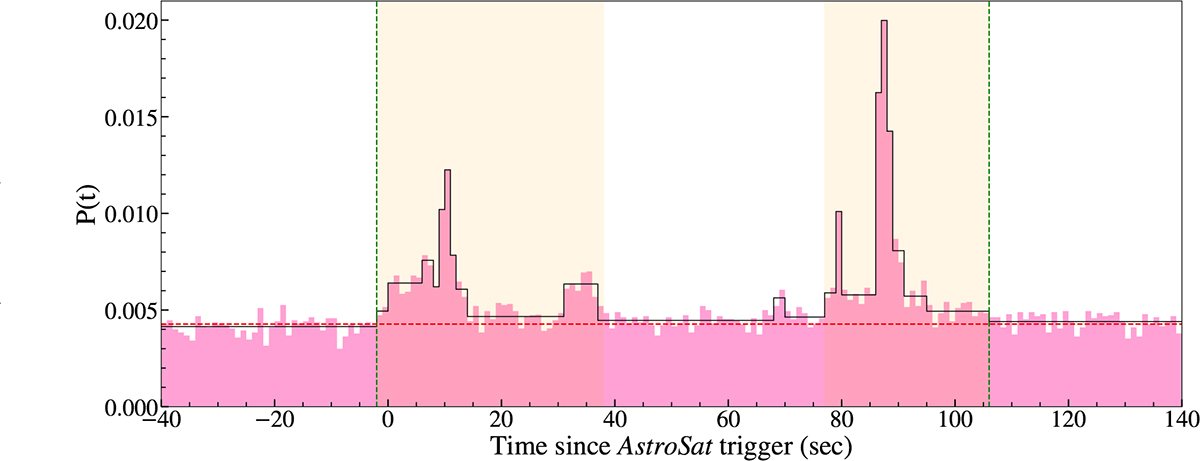
AstroSat/CZTI Compton light curve of GRB 220107A illustrating the temporal distribution of photon counts as a function of time since the T0. Bayesian block analysis was employed to delineate the time-integrated duration as well as the specific intervals for episode 1 and episode 2, which are selected for spectropolarimetric analysis. The vertical green lines mark the start and end times of these intervals, while the shaded beige regions highlight the durations of the first and second episodes, respectively. The dashed red line represents the baseline count rate, with peak intensities observed around −2–38 seconds and 77–106 seconds post-trigger, indicating significant emission episodes.
Current usage metrics show cumulative count of Article Views (full-text article views including HTML views, PDF and ePub downloads, according to the available data) and Abstracts Views on Vision4Press platform.
Data correspond to usage on the plateform after 2015. The current usage metrics is available 48-96 hours after online publication and is updated daily on week days.
Initial download of the metrics may take a while.