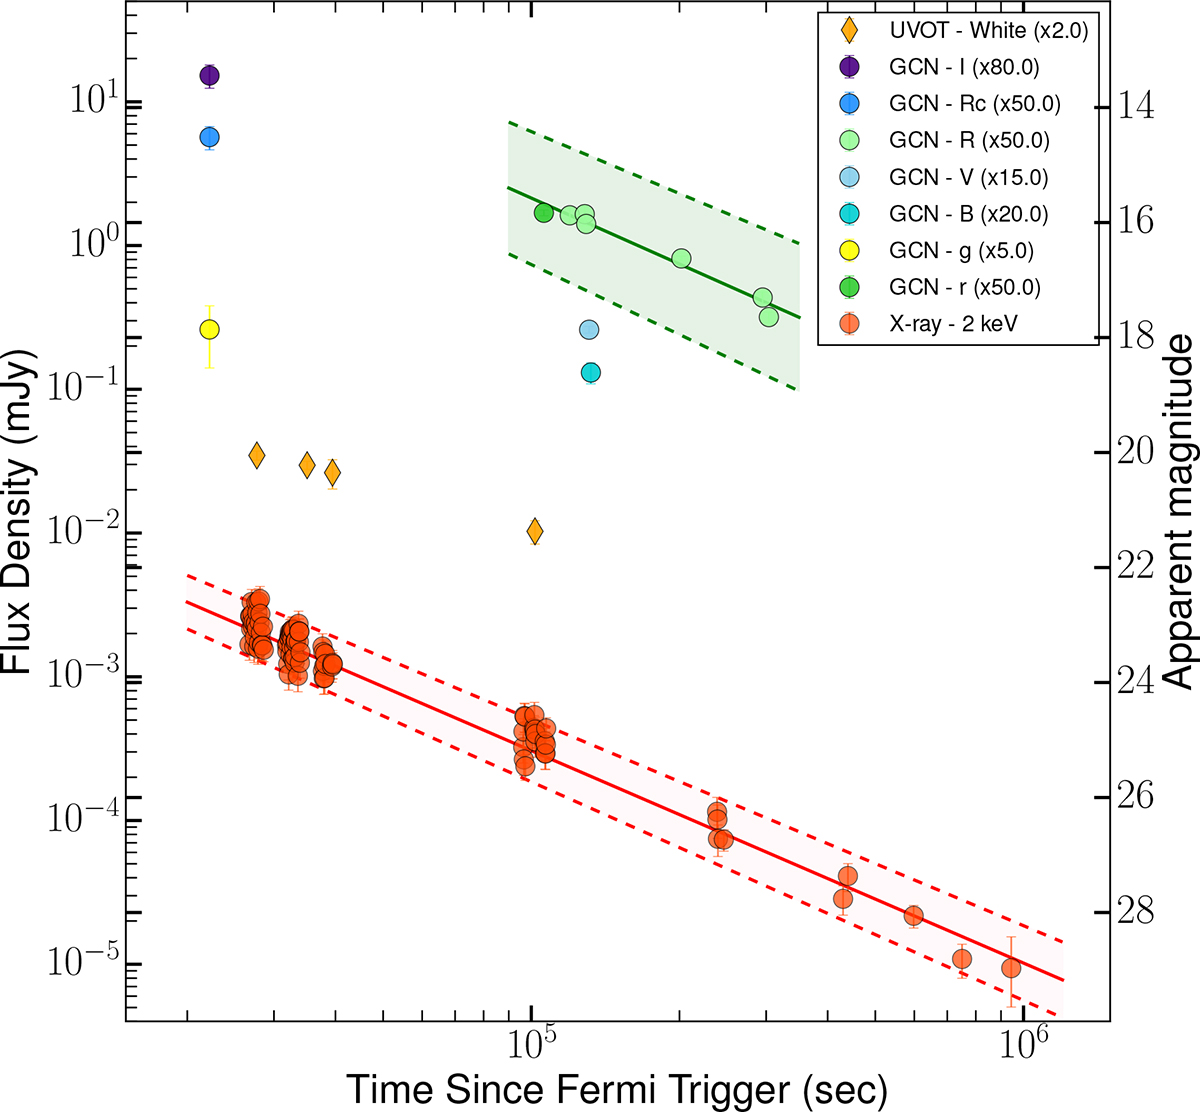
Fig. 10.
Download original image
Multiband afterglow light curve of GRB 220107A. Red points show the Swift/XRT flux density at 2 keV (right-hand axis, apparent magnitude scale at far right), and orange points show contemporaneous UVOT white-band detections (scaled as indicated in the legend). Colored circles represent ground-based optical photometry from MITSuME Akeno, Nanshan/NEXT, SAO RAS Zeiss-1000, AbAO AS-32, Terskol K-800, and other facilities (individual filter scalings are noted in the legend to improve visibility). Solid lines are single power-law fits to the X-ray (red) and R-band optical (green) data, and the surrounding shaded regions show the 1σ uncertainty bands from the fit. The X-ray and optical light curves are well described by simple power-law decays with indices αX = 1.48 ± 0.04 and αO = 1.52 ± 0.09, respectively, indicating an achromatic decline. The figure demonstrates the broadband temporal behavior of the afterglow and the agreement between X-ray and optical decay slopes, which we use to constrain the circumburst environment and emission regime.
Current usage metrics show cumulative count of Article Views (full-text article views including HTML views, PDF and ePub downloads, according to the available data) and Abstracts Views on Vision4Press platform.
Data correspond to usage on the plateform after 2015. The current usage metrics is available 48-96 hours after online publication and is updated daily on week days.
Initial download of the metrics may take a while.