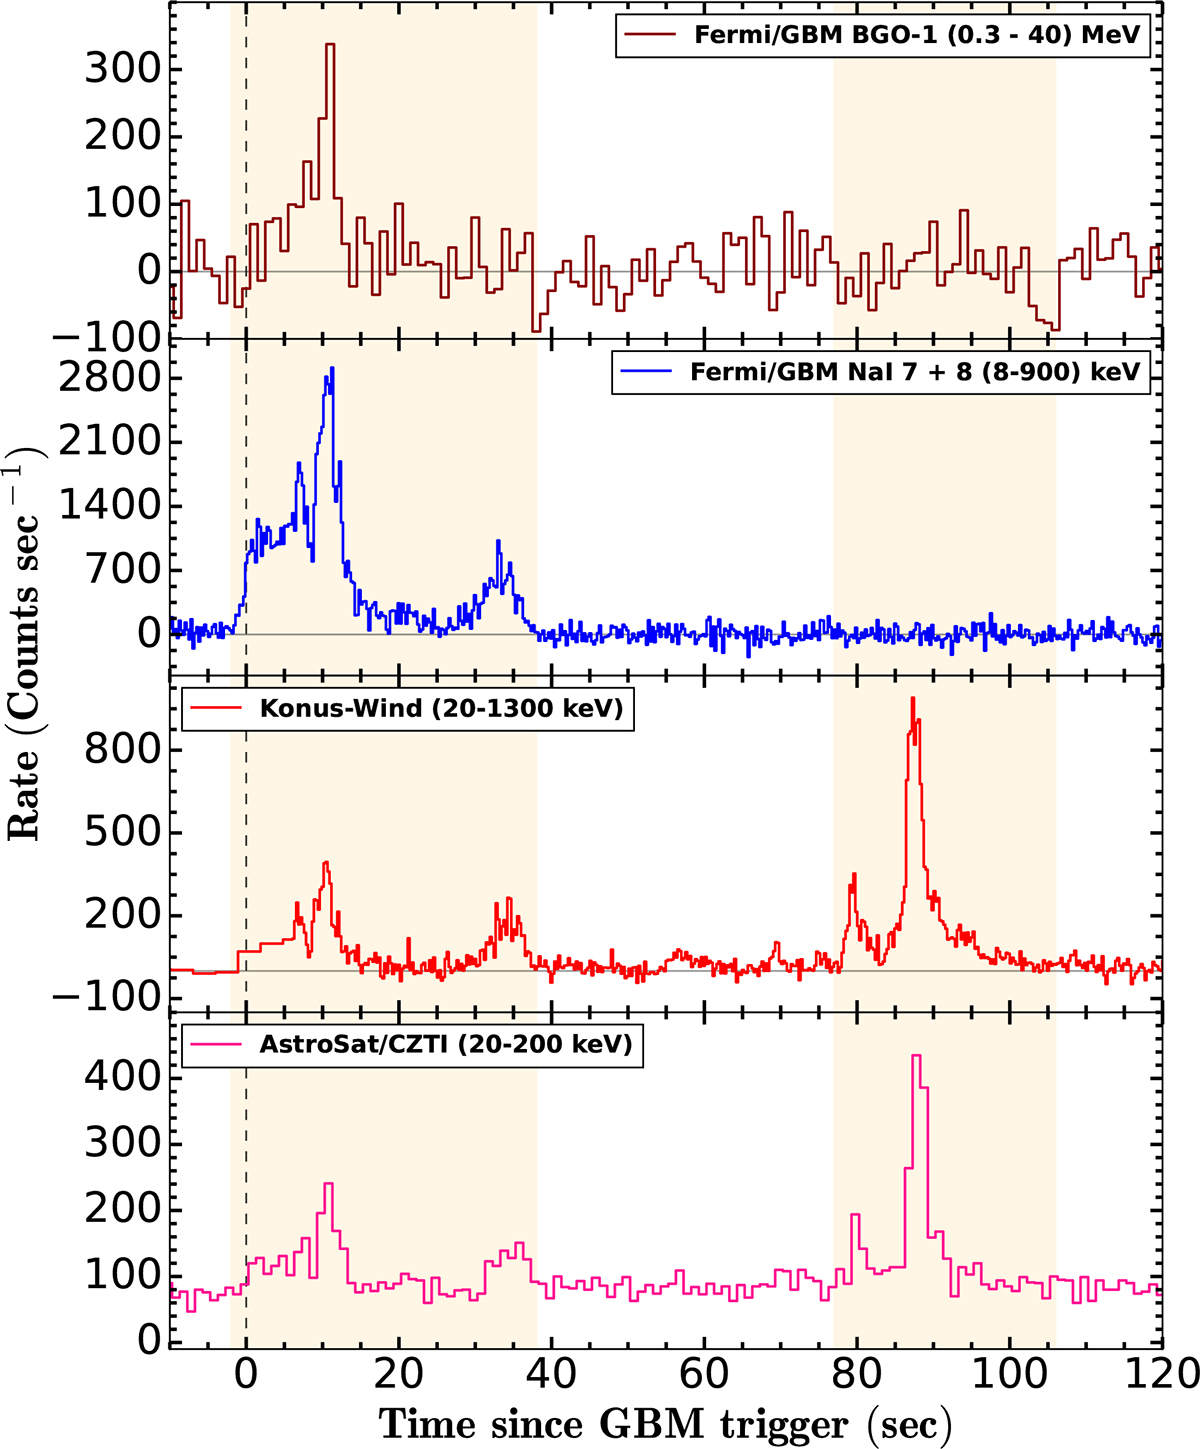
Fig. 1.
Download original image
Prompt light curve of GRB 220107A from multiple observatories across various energy bands. Both AstroSat/CZTI and Konus-Wind detected emission from the first and second episodes of the burst, whereas Fermi/GBM detected only the initial episode due to Earth occultation. The Konus-Wind light curve aligns with AstroSat/CZTI observations, confirming emission during the period when GBM was obscured. The vertical line marks the GBM trigger time, and the shaded regions indicate the durations of the first (T0 − 2 to T0 + 38 s) and second (T0 + 77 to T0 + 106 s) episodes.
Current usage metrics show cumulative count of Article Views (full-text article views including HTML views, PDF and ePub downloads, according to the available data) and Abstracts Views on Vision4Press platform.
Data correspond to usage on the plateform after 2015. The current usage metrics is available 48-96 hours after online publication and is updated daily on week days.
Initial download of the metrics may take a while.