Fig. 6
Download original image
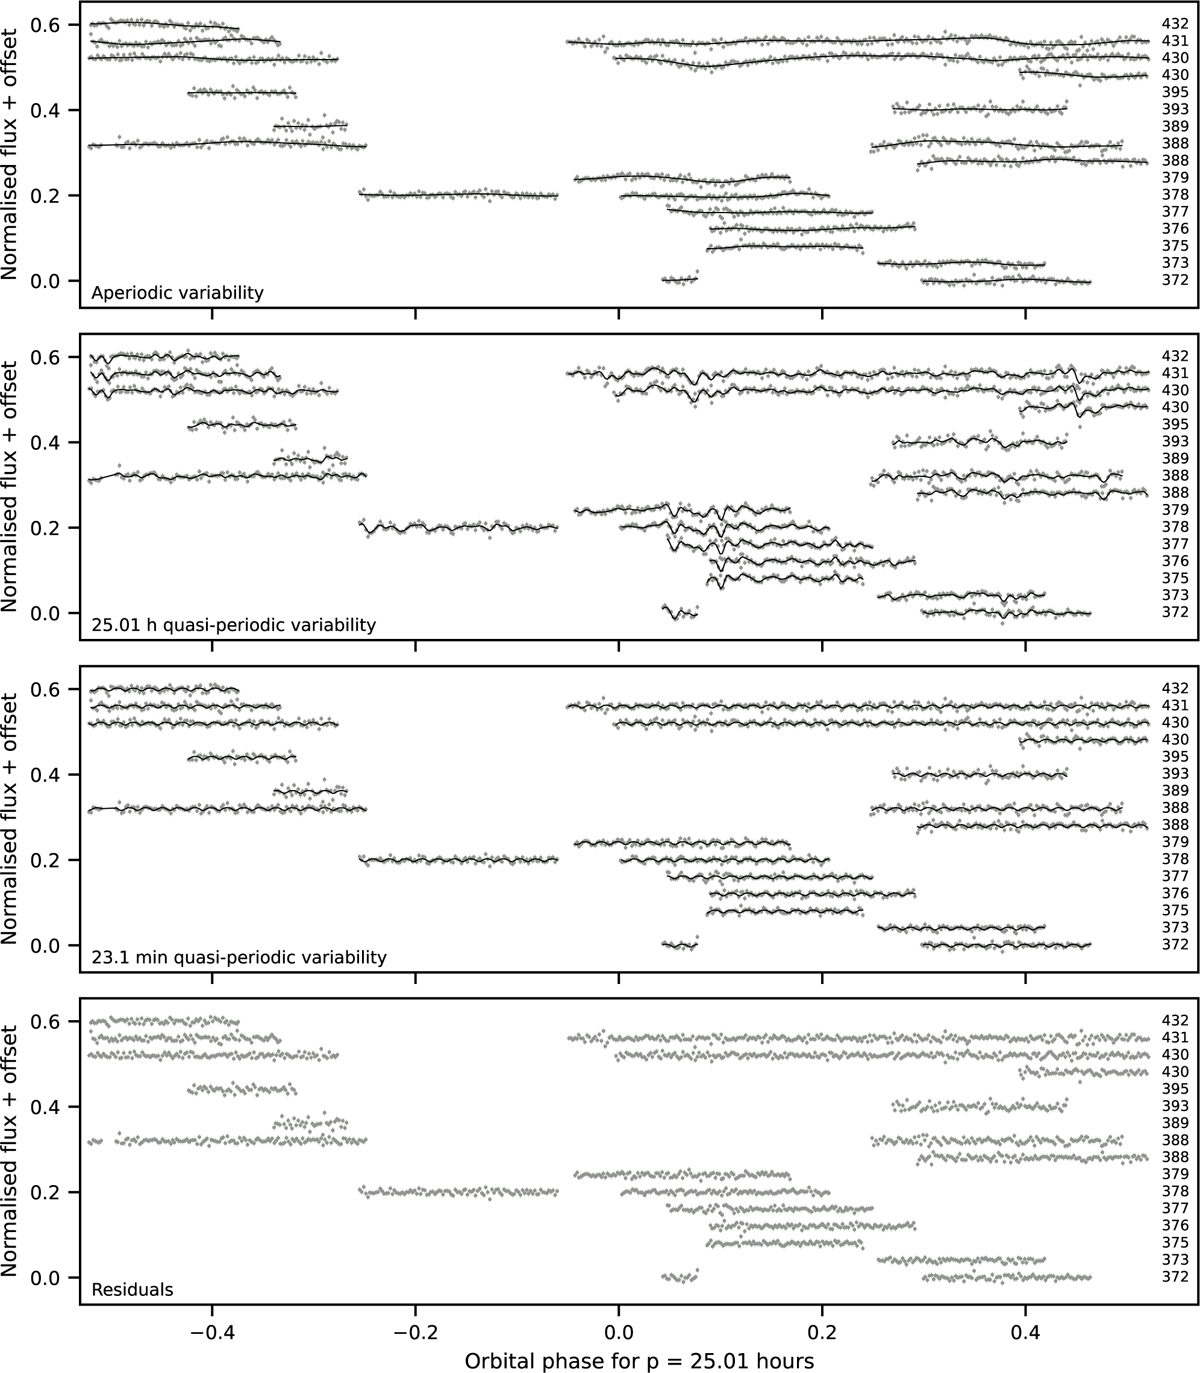
Ground-based LCOGT observations for January and March 2024 (points with error bars) together with the GP model consisting of an aperiodic component, a 25.01 h quasi-periodic component, and a 23.1 min quasi-periodic component (black line) folded over the 25.01 h period. Top three panels: each separate GP component without the other components from the observations and the model. Bottom panel: observation residuals with respect to the full GP model. The cycle number is marked on the right, starting from the first light curve in the dataset.
Current usage metrics show cumulative count of Article Views (full-text article views including HTML views, PDF and ePub downloads, according to the available data) and Abstracts Views on Vision4Press platform.
Data correspond to usage on the plateform after 2015. The current usage metrics is available 48-96 hours after online publication and is updated daily on week days.
Initial download of the metrics may take a while.